|
Refresher
on Research Methods Kevin R
Foster, CCNY Fall
2011 |
|
|
Topics
include:
1.
Basics
about
2.
Plagiarism
and rules for proper citations
3.
Internet
searches and databases (EconLit, JStor, Lexis/Nexus)
4.
Sources
of data for economics
5.
Basics
of computers: MS Word & Excel (including equation editor and Analysis
ToolPak)
6.
Math
Review (percentage growth, exponents, ex and ln(x))
7.
Crash
lesson on derivatives ("double the coefficient rule")
Below are
some (random) thoughts on each one. Note
that this online version is an ongoing draft – check periodically to get the
latest version. This is a draft, so
please be generous in sending suggestions, corrections, or errata to
kfoster@ccny.cuny.edu.
|
Don't just print
out the whole pdf file, please – that's a waste of paper! |
|
1. Basics |
Welcome to the
CCNY MA Economics program! I have a few
items here to give advice to new students.
Please excuse me if they are too basic, but I want to make sure that
everyone knows about these.
- Keep in touch! The MA advisor for Economics is Prof. Matt
Nagler. You've probably already
talked with him and/or me, and you should keep in regular contact. If you have any problems, speak with one
of us first. Don't wait; don't try
to hide and hope the problem goes away.
We will try to help you out – or at least give you an idea about
what options are available to you.
(Of course you can also talk with any of the other faculty &
staff here.) The worst problems for
students here come about when someone spends 6 or 8 weeks hiding, hoping
that their problem will go away, not realizing that they've dug themselves
into a deep hole from all of the waiting!
- On the same topic of keeping in touch
– activate your CCNY Email Account!
You can set it to auto-forward to another account (gmail, yahoo,
whatever…) if you read that one more often. You will get updates from me and from
other faculty sent out to the CCNY email address. You'll also get registration
information. If you don't check it
often enough, you will miss out.
- The CCNY email links to the
"Blackboard" course webpage, which you access through the CUNY
Portal (my webpage has a link as does the college web page).
- We also use InYourClass.com so login
there to chat with the class.
- Form and work with a study
group. You will learn more from
your fellow students than from any faculty member. Numerous studies have shown that
students working in teams learn more and do better on exams.
|
2. Plagiarism |
Read
CUNY's policy on acadmic integrity (on the course syllabus and CCNY web page).
see also http://www.dartmouth.edu/~sources/,
http://www.princeton.edu/pr/pub/integrity/index.html
http://www.economics.harvard.edu/files/WritingEconomics.pdf
- The essential idea is to differentiate your own
contributions, what is new about your analysis or compendium, as distinct
from what is taken from other sources.
- You must realize what constitutes intellectual
achievement: gathering diverse sources and comparing them one to another
is such an achievement. But you
must be clear about what is gathered, versus what points you are making
with your comparison.
RULES:
- when directly using someone else's words, these must be
in quotation marks with an explanatory reference (either cite, footnote,
or endnote)
example
of cite:
"The full time earnings of black and
Hispanic women averaged less than 60 percent of white male earnings"
(Ehrenberg and Smith, p. 417).
- if long quote (>50 words) then no quotation marks but
indent & single-space
example
of long quote with cite:
Word word word word word word word word word word word word word word word word word word word word word word word word word word word word word word word word word word word word word word word word word word word word word word word word word word word word word word word word word word word word word word word word word word word word word word (BlabBlab, p. 10000)
- when using your own words to state someone else's idea
or reproducing their image, graph, or data, you don't need quotes but
still need a reference.
example:
In 1997, Hispanic females earned 51% of what
White males earned (Ehrenberg and Smith, p. 417).
- cite is of a format that enables the reader to go to
your bibliography & find that reference. The usual style is (Author,
p. ##) for a book or (Author, Date) for an article or other reference.
- footnote or endnote is similar, but placed in a
different spot. I think cites work best for web pages.
- The Bibliography is at the end of the paper, and lists
all works used. Include data sources! Also books, articles, web pages,
images, graphs, etc. Make sure if your cite is a hyperlink, it gives
enough info for a reader of the hard copy to find the reference.
examples:
Ehrenberg, Ronald G., and
Robert S. Smith, (2000). Modern Labor Economics: Theory and Policy, seventh
edition.
Heckman, James, (1974).
"Shadow Prices, Market Wages, and Labor Supply," Econometrica, 42(4).
Bureau of Labor Statistics,
(2000). Data on "1998 Internet and Computer Use," downloaded from
http://www.bls.census.gov/cps/computer/1998/sdata.htm
Vames, Steven, (2000).
"Income Gains in March Outpaced Spending," New York Times Online,
April 28, 2000.
http://www.nytimes.com/yr/mo/day/news/financial/28tsc-economy.html
CONSEQUENCES
Failure to follow
these rules is a violation of Academic Integrity. This is a severe violation of the
basic principles of the academic community.
You may be brought up on academic charges before a Disciplinary
Committee of the College, where you are subject to a range of consequences up
to expulsion.
|
3. Internet
Resources |
An internet
search on a given topic will return a wide variety of hits. The most difficult task is to differentiate
the junk (most of it) from the few bits of useful information. Since you are a student, just beginning to
learn the field, it is only to be expected that you will have a more difficult
time distinguishing the good from the bad.
You must be wise, dutiful in checking out sources, and should ask
questions.
You might
usefully create a web page of your own.
This takes about 30 minutes to learn, and removes any mystery. Sometimes students think that publishing
online is difficult, so only very high-quality material should be online –
FALSE. Any imbecile can put any damn
thing online – and we do! You've got to
be careful. Blogs and wikis have lowered
the bar even further. A reader needs to
be careful and critical of every source.
There are certain
sources that have filtered out much of the worst junk. You can limit your search to only articles
published in refereed journals by searching online databases (from the CCNY
Library), such as EconLit and JStor. Of
course not everything that is published is correct – you must still be diligent
in finding recent sources, making your own evaluation of the plausibility of
the claims, and arriving at your own judgments.
Both of these
links are easily found from the CCNY Library's page, where you can pick them
from the list. You need to access them
from a CCNY computer, or else you will need a login (which the library can
provide you, however this takes time so don't wait for the night before the
paper is due!)
EconLit collects citations, most with a detailed
abstract, and a large fraction have full text available. "Full text" means that you don't
have to find the physical journal; you never touch paper. Just save the .pdf file that it produces. Sometimes there is no linked fulltext but a
Google search of author/title will hit.
A hint: one of my
favorite journals to recommend to students is the Journal of Economic
Perspectives (JEP). This gives
excellent overviews of particular topics in economics, meant to be accessible
to a non-specialist, written by some of the most prominent people in those
fields. It is published by the American
Economic Association (AEA) and is available through both EconLit and
JStor. The Journal of Economic
Literature (JEL) if also from the AEA and it also has occasional articles
that summarize a topic. The library has
both journals on the shelves – you can browse through these journals, just
skimming to find interesting articles.
It's a great way to spend a few hours!
JStor has the full text of articles published
in the foremost journals of various disciplines (including Economics, Finance,
and Statistics). Generally these
articles are at least 3-5 years old, but it gives access to every article in
the most important journals for the past several decades.
For news stories,
you can search Lexis/Nexus. This
collects the full text of major newspapers, including the New York Times and
the Economist. Again, you need to access
them from a CCNY computer, or get a login to work remotely.
There are other
outlets, such as prominent and well-regarded thinktanks and policy
institutions. In economics, the National
Bureau of Economic Research (NBER, at www.nber.org) is highly regarded, as is
the Brookings Institution (www.brookings.edu).
Of course all of
these sources give "the establishment view" not the ideas and
opinions of extremists. This is true by
definition: formerly extreme views become mainstream once "the
establishment" has published them.
I do not want to discourage you from research on the fringes, however
many classes at this College will require that you demonstrate a knowledge of
the mainstream. (Marx and Keynes began
their radical writings by first demonstrating their knowledge of what had been
written previously, to show where it had holes.)
Finally, the CUNY
library catalog is CUNY+. I often find
it useful to click on the tab for "Select Individual CUNY Libraries"
to search only CCNY's library. Then, if this
one doesn't have it, you can search the other CUNY schools.
|
4. Sources of data for economics |
There
are many sources of econmics data online.
Although the principal sources change depending on the field, here are
some of the basics:
http://rfe.org – RFE is Resources for Economists,
sponsored by the American Economic Association.
It is a great site, a clearinghouse for all of the important econ sites.
http://www.federalreserve.gov – The
Federal Reserve
http://www.ny.frb.org – our own
http://www.census.gov/ the
[or http://www.census.gov/main/www/subjects.html
is a list of topics on which the Census Bureau has data.]
http://stats.bls.gov/ is the Bureau of Labor
Statistics
http://www.oswego.edu/~economic/data.htm
is a good portmanteau of links from SUNY Oswego
http://www.worldbank.org/lsms/ World
Bank
CPI
Chained http://www.bls.gov/cpi/super_cpi.pdf
Overview
of BLS data www.bls.gov/bls/inflation.htm
GDP
Deflator (from BEA) www.bea.gov/bea/dn/home/gdp.htm
Overview
of BEA data http://www.bea.gov/
GDP
www.bea.gov/bea/dn/home/gdp.htm
NIPA
tables www.bea.gov/bea/dn/home/gdp.htm
Unemployment
www.bls.gov/cps/home.htm
Wages
www.bls.gov/bls/employment.htm
BLS
details on coverage www.bls.gov/opub/hom/homch1_a.htm
5. Basics of computers: MS Word & Excel
(including equation editor and Analysis ToolPak) |
Scary basic...
You will be using
a few computer programs a lot while you're in college. The most common programs that an econ student
would use are:
-
an
internet browser, like Microsoft's Internet Explorer or Mozilla's Firefox (many
tech sites rate Firefox higher than IE) or Google Chrome or Apple Safari or
Opera or ....
-
a
word processing program, probably Microsoft Word although OpenOffice gives a
free version
-
a
spreadsheet, probably Microsoft Excel although OpenOffice gives a free version
-
a
presentation program, such as Microsoft PowerPoint or OpenOffice version
-
data
analysis programs such as SAS or SPSS (for econometrics)
-
mathematical
programs such as Matlab or Gauss (for advanced work)
I recommend
OpenOffice to you, especially if you have a little netbook. It does most everything that you would pay
Microsoft for but it's free.
The internet browser is one of the most
basic, which you've used if you've ever read a web page. In the Econ computer lab, just double click
(click the left-hand button on the mouse twice in quick succession) when the
arrow (moved by the mouse) is on the picture above the words "Internet
Explorer." From there you can click
to find the world!
The word processor is what you'll use to
write papers. You basically just type
the text that you want. It has a few
extras, for instance you can click on "Insert" (on the bar on top)
and choose to insert pictures (if you have them on disk) or charts from a stats
program. The other common thing to
insert is an equation. Getting to the
equation editor requires going to "Insert" then "Object…"
then find "Microsoft Equation" under the "Create New"
tab. Equation Editor is useful to
produce text such as:
or whatever
ferocious-looking stuff you want to create.
Read the Help section to figure out all of the details of how to create
equations with subscripts, superscripts, sum and integral signs with the proper
notations, etc.
The more practice
you have with MS Word, the better you'll get, using things like bold, italics,
sub- or super- scripts, new
fonts,
tables, pictures, graphs, etc.
You can get tips from other students, who were once as new to computing
as you are now! There's no shame in not
knowing something; the shame is to choose to remain ignorant.
If you go to
"File" then "New" you can find templates for common
document types: they have some decent resume templates, for instance. Of course if you're a professional graphic
designer you can do better, but if you're a novice you can do worse!
The next common
MS program is Excel, for spreadsheets. This is just a fancy calculator that can do a
great deal of work for you. You might
use it in many classes. Suppose you have
data on some statistic that x = 100, 110, 121, 133. You type those four values into the
spreadsheet like this:
|
100 |
|
110 |
|
121 |
|
133 |
Suppose you want
to find the percent growth. The formula
for percent growth from x0 to x1 is  . So in the next
column we want to type a formula to find this growth rate. The first row we leave blank, but the next
row we type the equals sign, "=", which tells the program that you're
entering a formula.
. So in the next
column we want to type a formula to find this growth rate. The first row we leave blank, but the next
row we type the equals sign, "=", which tells the program that you're
entering a formula.
|
100 |
|
|
110 |
= |
|
121 |
|
|
133 |
|
Then after typing
the equal sign (but before hitting return or some other key) we can just click
to reference any other value. We want to
find the difference so we click on the cell where we typed "110" then
the minus key, "-", then click on the cell where we have 100. Note that Excel will fill in its version of
the formula: if you typed the numbers in column A and the formula in column B,
then the formula in the second row of column B (which is B2) will read
"=A2-A1" which tells Excel to subtract the value in A1 from the value
in A2. It will look like:
|
100 |
|
|
110 |
=A2-A1 |
|
120 |
|
|
130 |
|
Now hit enter and
Excel will calculate the value. Next you
can then copy the formula (click on the cell with the formula you want then
"Edit/Copy") and paste it in to the other cells, getting:
|
100 |
|
|
110 |
10 |
|
121 |
11 |
|
133 |
12 |
For only four
numbers that's not a big time-saving but you can imagine if you have, say,
quarterly data on GDP back to 1948. To
find the percent change we next take the difference and divide by the initial
value, so in the second row of column C we type "=" again, then click
on the cell with 10 then the divide "/" then click on the cell with
100. Now Excel creates the formula
"=B2/A1", or 0.1. Copy this
down so get:
|
100 |
|
|
|
110 |
10 |
0.1 |
|
121 |
11 |
0.1 |
|
133 |
12 |
0.099174 |
If you forget how
to convert decimals to percents you just highlight the cells in column C that
you want to format, click on the "%" button, and Excel does it for
you.
Of course you
would have done the calculation in one step by entering the formula (in D2) as
"=(A2-A1)/A1".
You will quickly
figure out that you can write much more complicated formulas, which can use
Excel's embedded formulas: from simple ones like "=sqrt(A2)" to
ln(A3) to particular Excel formulas (check the Help menu or the button marked ![]() to see a list) for
stats like Average, financial formulas for annuities or time value of money
problems, even some that you probably haven't heard of.
to see a list) for
stats like Average, financial formulas for annuities or time value of money
problems, even some that you probably haven't heard of.
Excel will plot
figures ("Insert" then "Chart" to see the many types) and
do basic data analysis ("Tools" then "Data Analysis" for
regressions, histograms, lots of the basics).
You can use it to present and analyze small datasets. (Where "small" is hard-coded into older
versions of the program to mean less than about 65,000 observations.) Macro data is often short enough to fit (even
monthly data on, say, industrial production, is available for maybe 70 years so
that's just 840 obs!) while many other datasets are far larger.
But note that you
must have the "Analysis TookPak" installed, if you're using Excel at
home. For Excel 2003 you can just find
"Add-in's" and follow those instructions; for other versions you
should just search under the Help menu for Analysis TookPak (note the strange
spelling – another reason to condemn Bill Gates).
|
6. Math Review (percentage growth, exponents,
exp and ln(x)) |
Percent:
Remember that a percent is just a
convenient way of writing a decimal. So 15% is really the number 0.15, 99% is
0.99, and 150% is 1.50. I assume you know this, but sometimes it can get
confusing. For instance, we might want to find 10% of 10%. We CANNOT
just multiply 10*10, get 100, and leave that as the answer! Rather we first
convert them to decimals and then multiply: so 0.10 * 0.10 = 0.01 = 1%.
Examples: (click on the ? to get the answers).
30%*7% + 70%*5% = ?
50%*10% + 50%*3% = ?
Percentage Change (Growth
Rate):
Consider GDP in the Great
Depression. The data (billions of $) are:
|
1929 |
103.8 |
|
1930 |
91.1 |
|
1931 |
76.4 |
|
1932 |
58.6 |
|
1933 |
56.2 |
We want to figure out the
percentage change in GDP during the Depression. We can see that, from 1929 to
1930, US GDP fell by $(103.8 - 91.1) bn = $12.7 bn. But how big is this? From
the first to the second quarter of 1997, US GDP grew by $108.4 bn (from 7955 to
8063.4). The economy has gotten much larger in the intervening span of time.
The percentage change in GDP tells us how large the fall in GDP was, relative
to the total amount of $103.8bn available to be lost.
So we calculate the percentage
change in GDP as (91.1 - 103.8)/103.8, which is -0.1223. To make this decimal
into a percentage, we multiply by 100 (move the decimal point 2 spots to the
right), so this is a growth rate of -12.23% (or a fall of 12.23% -- sometimes
we use a word instead of the negative sign). In general, if we have values for
some series, x, and write x1, x2, x3, ...
(where the subscript number refers to the time period) the percent change from
time 1 to time 2 is 100 * . We also sometimes write this as the change in x (
![]() ) divided by the level of x, or 100*
) divided by the level of x, or 100*![]() . Finally, we can also calculate the percentage change as
100*
. Finally, we can also calculate the percentage change as
100* which is the same
thing (as a bit of algebra should be able to convince you).
which is the same
thing (as a bit of algebra should be able to convince you).
Examples:
What are the percent changes for
US GDP in the years of the Great Depression? Answer.
Calculus and Percentages:
Calculus (for those of you who
have taken the course) can simplify our use of percentages and percentage
changes. Remember that the derivative gives us the change in the value, so ![]() . Then remember that the derivative of the natural logarithm
is
. Then remember that the derivative of the natural logarithm
is  , which is the formula for the percent change. Thus the
derivative of the natural log is the percentage change (another reason that
logarithms are your friend!).
, which is the formula for the percent change. Thus the
derivative of the natural log is the percentage change (another reason that
logarithms are your friend!).
Percent:
30%*7% + 70%*5% = 0.3*0.07 +
0.7+0.05 = 0.021 + 0.035 = 0.056 = 5.6%
50%*10% + 50%*3% = 0.5*0.1 +
0.5*0.03 = 0.05 + 0.015 = 0.065 = 6.5%
Percent Change in
|
1929-30 |
-0.12235 |
|
1930-31 |
-0.16136 |
|
1931-32 |
-0.23298 |
|
1932-33 |
-0.04096 |
Review of Math: exponents, the mysterious
e, and natural logarithms
You might not
have used exponents recently so you may have forgotten the details. To review, recall that exponents are simply a
compact way of writing out multiplication (just as multiplication just means
adding many times). So 102 is
10 multiplied by itself twice, 10*10=100.
Then 103 = 1000, 33 = 27, and 25 =
32. (Note that some computer programs,
where superscripts are difficult, use the symbol ^ so they would write 10^3,
3^3, and 2^5. Both these are often used
when the exponent is a complicated function, so that the poor reader doesn't
strain her eyes reading tiny superscript type.)
That is pretty
simple, but then the mathematicians asked, what if these exponents are not nice
counting numbers but zero, or negative, or fractions? First, any number raised to a zero exponent
is defined as being equal to 1. Negative
exponents are defined as raising the reciprocal to that power, so 10-2
is 1/100 = 0.01, 3-3 = 1/27, and 2-5 = 1/32.
Note that for
numbers in decimal format, exponents mean moving the decimal point left or
right: 3.1415*102 = 314.15; 3.1415*10-2 = 0.031415.
Fractional
exponents are defined analogously to their whole-number relatives: if 102
is 10*10=100 then ![]() "un-does"
this, taking the square root so getting back 10. Again, so this means that
"un-does"
this, taking the square root so getting back 10. Again, so this means that ![]() and
and ![]() .
.
From these
examples we can figure out some of the basic rules for what happens when two
numbers, with a common base, are multiplied together or when a base-exponent
pair is itself raised to a power.
First, what is 23
* 22 = ? By the definition of
exponents, 23 = 2*2*2 and 22 = 2*2 so 23 * 22
= (2*2*2)*(2*2) = 25. This
rule generalizes (not all examples do!) to the form that, given a base x,
exponent A and exponent B,
![]() .
.
This holds as
long as x, A, and B are real numbers (positive, negative, fractions, zero,
whatever).
Next, what if we
had, instead, ![]() =? Again we just write
out the simple meanings of those exponents.
Working from outside in, any number that is squared is simply multiplied
by itself so
=? Again we just write
out the simple meanings of those exponents.
Working from outside in, any number that is squared is simply multiplied
by itself so ![]() . The general rule,
for a base, y, and exponents C and D, is that:
. The general rule,
for a base, y, and exponents C and D, is that:
![]() .
.
Again, this holds
for all real numbers. (I'm ignoring
imaginary numbers only because economists don't often use those – contrary to
many criticisms!)
You can see that
the rules for exponents are, in some sense, taking the operations down a rank:
multiplying two numbers with exponents means adding exponents; taking exponents
of a number with exponents means multiplying the exponents.
Let me point out
a couple of common applications of these rules (and a couple of others):
 .
.- But
 (no good trick
there!).
(no good trick
there!). - The number 1, to any power, is still
1.
Next is
logarithms. These arise quite naturally
if we want to un-do the operations of exponents. From knowing that 103 = 1000,
suppose we asked, 10 to what power equals 1000?
We could write 10x = 1000 or that log10(1000) =
x. The difference is only notational.
The Mysterious
"e"
Mathematicians
have come to depend on one particular special number when working with
exponents, which is notated e.
It's like pi (p), 3.1415… because it's a number (called a
transcendental) that goes on forever and seems quite mysterious until you've
worked with it a while and gotten used to it.
For now, take
this information on faith, don't worry too much about where this number comes
from. (If you want to prove that
mathematics has logical holes, that might possibly all come crashing down,
you're too late – Gödel did it decades ago!)
The number, e, is the area under a hyperbola (the equation y=1/x)
rightwards from 1. Where π is a basic measure for a circle (it is the
area of a circle with radius of 1), e is a basic measure for calculus, because
ex is a function of x with derivative ex.
The mysterious e
can be understood in the context of finding interest rates. Suppose you had $100 to invest at a 10%
interest rate. After a year, it would
clearly be worth $110. But suppose that
another bank offered the same 10% rate, but with a bit of a difference: after
six months they calculate the interest up to then (the 5%) and then again after
six months they do the same. So you get
the effect of compounding: after one year, you'd have $110.25. What if another bank offered to
"compound" three times? Four? More?
In the limit, compounding daily or hourly or minutely, approaching
"continuous compounding" which would get you a final balance of 100*e0.1
= 110.5171 (you could see this with a simple Excel sheet).
Now, in the real
world, banks don't generally offer these continuously compounded rates, but
it's nice for our theories. It also
comes in handy for growth and decay processes and solving differential
equations. The mathematicians have
learned to love it, and even have figured out that eip (using i, the value of the square root of
negative one, and pi) is 1, which brings together some of the strangest bits of
math.
The inverse
function, to un-do what ex does, is the natural logarithm, denoted
ln(x). This is the same as loge,
log with base e. The notation, ex=y,
is asking, taking e to what power (y), will give me an answer of x. The "natural" logarithm is natural
because it uses the same number, e, that we figured out above as having
desirable features for growth. The main
problem to watch for (particularly if you're making transformations of one
variable to another) is that e cannot be raised to any power to make it equal
to zero or less (negative). So ln(0) or
ln(-1) return nonsense answers (either
Outside finance, the
macroeconomists probably make the greatest use of ex and ln(x),
because of the connection with growth.
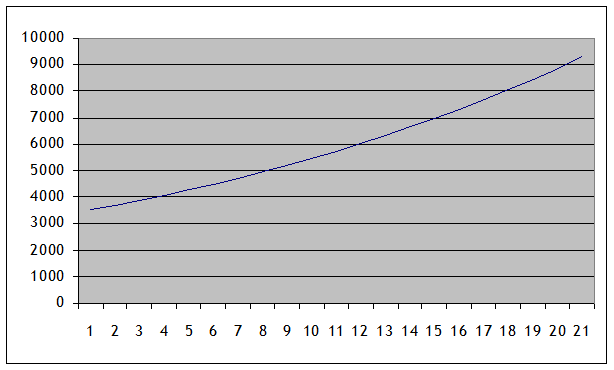
Suppose that an economy's GDP grows at 5% per year, every year, for 50
years (assuming continuous compounding, so that by the end of the 50 years, it's
grown to nearly 12 times its original size.
A graph of raw GDP would look like this (starting at 1):

shooting up to
ever-larger values, quickly becoming difficult to work with. (For instance, can
you tell, just from the graph, how big the economy is after 25 years? It's somewhere between 2 and 4 times as big
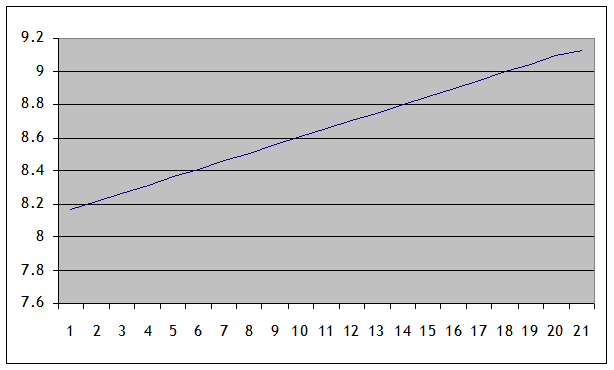
as it started, but that's about all that you could tell.) So taking the natural log of GDP would return
a nice series like this:
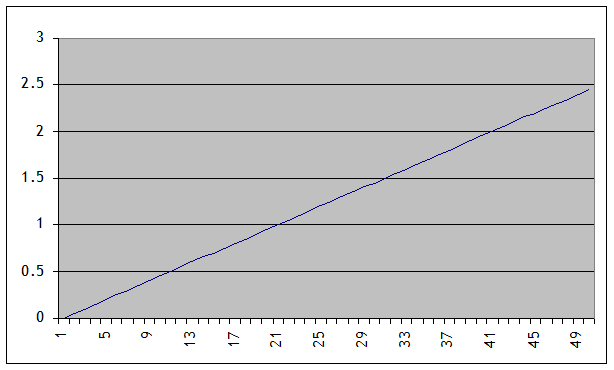
It's transformed
from a difficult graph to a simple line.
This is equivalent to plotting the previous graph on a log scale.
If the
"log" referred to were to a base 10, then the graph would essentially
be plotting how many zeros were in the GDP: from 1 to 10 is adding a zero, from
10 to 100 is adding another, etc. When
the "log" referred to is base e, then the interpretation as
"zeros before the decimal" is no longer quite correct, but it's
similar.
GDP values often
have these growth paths, along with financial values (so the value of the Dow
Jones average of the
Politicians often
play games with these sorts of numbers (knowingly or unknowingly) to confuse
innumerate people. Suppose an economy
has been growing at 5% per year for many years, attaining last year's lucky GDP
of 8888 per person. In the last year, a
new political party took power and now GDP per person is 9188. The new political party might brag that they
"grew" GDP by 300, and show a graph like this:
The slow-down in
growth is tough to see. But the growth
rate did actually slow, which a log-chart would show, so that:
Where you can see
that the line sags noticeably in the last year charted. A 5% growth rate would have gotten the
economy to 9332 not 9188, so the new policies could be criticized for stopping
a twenty-year record of steady growth.
|
7. Crash lesson on derivatives ("double
the coefficient rule") |
The derivative
gives us the slope of a function at a particular point.
A line always has
the same slope, so if the equation for a line is:
![]()
then the slope is
![]() at every point. (When X rises by 1, Y rises by m.)
at every point. (When X rises by 1, Y rises by m.)
But other lines
have different slopes at different places.
Consider the function,
![]() . This is a parabola,
a smooth curve that, near zero, has a very low slope, but then gets steeper and
steeper. Can we find a neat equation
that tells us exactly how much steeper?
Yes: the derivative. The
derivative of
. This is a parabola,
a smooth curve that, near zero, has a very low slope, but then gets steeper and
steeper. Can we find a neat equation
that tells us exactly how much steeper?
Yes: the derivative. The
derivative of ![]() is
is ![]() -- we take the
coefficient on the x-squared term (which is 1) and double it.
-- we take the
coefficient on the x-squared term (which is 1) and double it.
If there were
some other coefficient, say:
![]() , then the derivative would be
, then the derivative would be ![]() .
.
If there were
both linear and squared terms added together, then we would proceed
item-by-item:
![]() has derivative
has derivative ![]() .
.
[Note: this only
works for items added together.]
Want to know
more? Take calculus – it's fun and
healthy!