|
Overview of ATUS Econ B2000 Kevin R Foster, CCNY Fall 2012 |
|
|
We will use data from the "American Time Use Survey," or ATUS. This asks respondents to carefully list how they spent each hour of their time during the day; it's a tremendous resource. The survey data is collected by the US Bureau of Labor Statistics (BLS), a US government agency. You can find more information about it here, http://www.bls.gov/tus/.
The dataset has information on 112,038 people interviewed from 2003-2010. This gives you a ton of information – we really need to work to get even the simplest information from it.
We will work on this data using SPSS. For an overview of the basics of how to use that program, find the separate class document online.
The dataset is ready to use in SPSS. Download it from the class's Blackboard page onto your computer desktop. If it is zipped, then unzip it. Remember that if you're in the computer lab, just double-clicking on the SPSS file may not automatically start up SPSS; you'll get some error code. So use the Start bar to find SPSS and start it that way. Then open up your dataset once the program has loaded.
The ATUS has data telling how many minutes each person spent on various activities during the day. These are created from detailed logbooks that each person kept, recording their activities throughout the day.
They recorded how much time was spent with family members, with spouse, sleeping, watching TV, doing household chores, working, commuting, going to church/religious ceremonies, volunteering – there are hundreds of specific data items!
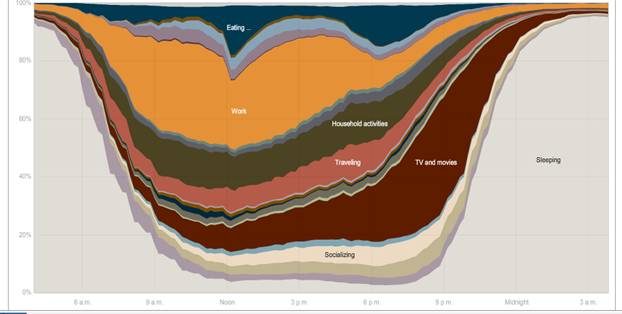
The NY Times had this graphic showing the different uses of time during the day [here http://www.nytimes.com/interactive/2009/07/31/business/20080801-metrics-graphic.html is the full interactive chart where you can compare the time use patterns of men and women, employed and unemployed, and other groups – a great way to lose an evening! The article is here http://www.nytimes.com/2009/08/02/business/02metrics.html?_r=2 ]
To use the data effectively, it is helpful to understand the ATUS classification system, where additional numbers at the right indicated additional specificity. The first two digits give generic broad categories. The general classification T05 refers to time spent doing things related to work. T0501 is specific to actual work; T050101 is "Work, main job" then T050102 is "Work, other job," T050103 is "Security Procedures related to work," and T050189 is "Working, Not Elsewhere Classified," abbreviated as n.e.c. (usually if the final digit is a nine then that means that it is a miscellaneous or catch-all category). Then there are activities that are strongly related to work, that a person might not do if they were not working at a particular job – like taking a client out to dinner or golfing. These get their own classification codes, T050201, T050202, T050203, T050204, or T050289. The list continues; there are "Income-generating hobbies, crafts, and food" and "Job interviewing" and "Job search activities." These have other classifications beginning with T05 to indicate that they are work-related.
So for instance, to create a variable, "Time Spent Working" that we might label "T_work," you would have to add up T050101, T050102, T050103, T050189, T050201, T050202, T050203, T050204, T050289, T050301, T050302, T050303, T050304, T050389, T050403, T050404, T050405, T050481, T050499, and T059999. You might want to add in "Travel related to working" down in T180501. (No sane human would remember all these codings but you'd look at the "Labels" in SPSS and create a new variable.) It's tedious but not difficult in any way.
Some variables are even more detailed – playing sports is broken down into aerobics, baseball, basketball, biking, billiards, boating, bowling, ... all the way to wrestling, yoga, and "Not Elsewhere Classified" for those with really obscure interests. Then there are similar breakdowns for watching those sports. Most people will have a zero value for most of these but they're important for a few people.
You can imagine that different researchers, exploring different questions, could want different aggregates. So the basic data has a very fine classification which you can add up, however you want.