|
Possible Solutions for Homework 8
K Foster, Options & Futures, Eco 275, CCNY, Spring 2010 |
|
|
- Assignment Question 20.17 in Hull.
Hull provides the formula from stats, that . A one standard deviation fall in the price of gold would hit the portfolio by 300000(.018)(sqrt(T)) = $17,076. A one standard deviation fall in silver would hit the portfolio by 500000(.012)sqrt(T) = 11,384. Put these figures for the volatilities of X and Y into the formula above and find the volatility for the combined portfolio is $25,583. A 97.5% event is 1.96 standard deviations so this means that the portfolio has VaR of 1.96*25583 = $50,141. The VaR of just the gold would be 1.96*17,076 = $33,469; the VaR of just the silver is 1.96*11384 = $22,313. So the VaR of the two separate positions is $55,782; the diversification reduces this by $5640.
- Consider options on euros – which are quite volatile because of Greece. The euro-linked contract traded for 133.95. Options were traded at strikes and prices given in the table below. Figure out the implied volatility of each option. What is the delta and gamma of each? If you had a portfolio that was long in each option, what would be the VaR? (Extra: can you find a cheaper portfolio with a lower VaR?)
I assumed that domestic and foreign interest rates were both 2% and that time is 1.5 months (I forgot to tell you that in the question).
see hw8sol.xls for details; those calculations give these figures:
|
Last |
Strike |
Bl-S-M price |
implied volatility |
delta |
gamma |
|
|
put |
0.44 |
124 |
0.440 |
0.183 |
-0.884 |
0.022 |
|
put |
0.27 |
125 |
0.270 |
0.149 |
-0.909 |
0.023 |
|
put |
0.35 |
126 |
0.350 |
0.146 |
-0.887 |
0.028 |
|
put |
0.57 |
127 |
0.570 |
0.155 |
-0.840 |
0.033 |
|
put |
1.21 |
130 |
1.209 |
0.153 |
-0.716 |
0.047 |
|
put |
1.6 |
132 |
1.600 |
0.138 |
-0.629 |
0.058 |
|
put |
1.85 |
132.5 |
1.850 |
0.141 |
-0.596 |
0.058 |
|
call |
3.32 |
134.5 |
3.320 |
0.181 |
0.523 |
0.046 |
|
call |
2.06 |
135 |
2.061 |
0.127 |
0.556 |
0.066 |
|
call |
1.21 |
137 |
1.210 |
0.121 |
0.687 |
0.062 |
|
call |
1 |
139 |
1.000 |
0.142 |
0.762 |
0.046 |
|
call |
0.12 |
146 |
0.120 |
0.138 |
0.959 |
0.013 |
|
call |
0.2 |
148 |
0.200 |
0.172 |
0.948 |
0.013 |
|
call |
0.11 |
150.5 |
0.110 |
0.174 |
0.970 |
0.008 |
The delta and gamma are simply taken from the formulas in the lecture notes, that , , and .
The implied volatility surface is
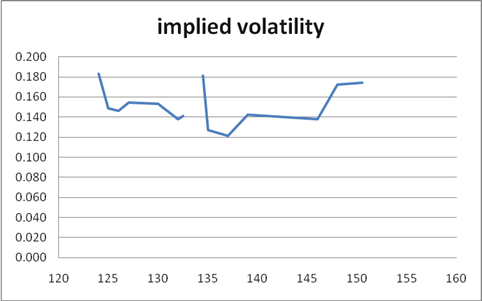
which clearly shows that the call nearly at the money, with K=134.5 and implied volatility of 18%, is overvalued.
To figure VaR, we go back-and-forth between returns (percent changes, ) and price changes (absolute change, un-scaled).
In continuous time so so estimate .
In discrete time, so estimate .
We need to find a 1% or 5% critical value – the number of standard deviations that are that risky. Using the normal distribution we find either 2.326 for 1% or 1.64 for 5%.
If the portfolio is constructed of options then we use the same -2.326 standard deviations (assuming we want a 1% VaR) and use the return volatility to decide the critical value of the return, . Just put these into the equation above, using deltas and gammas of the portfolio, .
Daily volatility is assumed to be of the annual rate, or so this implies that a drop that is at the fifth percentile of bad outcomes would be = 1.87% if we use 18% volatility (a conservative figure).
In the case of a portfolio with one of each derivative in the table, falls of the price imply rises of portfolio value so it is rises in the price that will hurt the portfolio value. So a 1.87% rise is a move up from 133.95 of 2.53.
This gives a 5% VaR of losing about $0.14 or 1% of the portfolio value (using just the delta method). Or we could use the formula that (the next column, the delta-gamma calculation), which would imply that the 5% VaR is for a drop in portfolio value of $1.51 or over 10%. The delta-gamma method would be preferred as more accurate.
- A stock in the "ACME Corp" (monopoly suppliers of cartoon tools!) has 30% volatility over a year. ACME's current price is 10. Your portfolio is long with 100,000 shares of the stock (bought at 10), long 40 contracts (each on 1000 shares) of puts with strike prices of 7, 8 and 9 (expiring in 3 weeks) and long 50 contracts of a call with a strike price of 11, which has one month to expiry. A riskless bond pays 2% per year (compounded continuously).
- Assuming Black-Scholes-Merton holds, calculate the portfolio value.
The payoff graph (if the options all expired at the same time) is
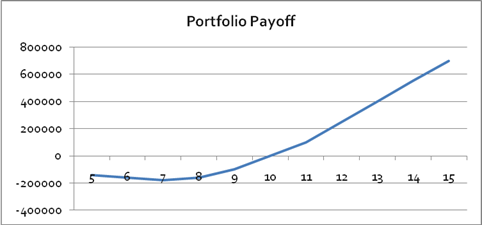
The actual values are shown in the spreadsheet: the put with K=7 has value nearly zero, the put with K=8 has value .0002, the put with K=9 has value .023, and the call is worth .365 (per share; each contract is 1000 so the value of each contract is 1000 times as big). These contribute only a small amount to the value of the portfolio: the 1,000,000 of shares plus 3945 for the options.
- What is the portfolio delta?
The delta calculations are in the spreadsheet. The delta for the portfolio is 100,000 for the shares and 2557 for the portfolio including the four options.
- What is the portfolio's 1% one-day VaR? Its 5%?
At 30% annualized volatility, a one-day standard deviation is .3/sqrt(250) = .019. With price of ten, this is a 0.19 change in the stock value. Its 5% critical value is -1.64 standard deviations or $-0.31; its 1% critical value is -2.33 standard deviations or $-0.44.
If we just use a delta approximation then the one-day VaR is the value, -0.31 or -0.44, times the delta from above, so $32,007 at 5% and $45,268 at 1%.
A gamma approximation would be more accurate.
- You consider adding a contract of a call on the index (index currently trades at 1000; each index contract is equivalent to 100 times the index; the call has K=1050; the index volatility is 12%). If ACME has a beta of 0.75 with the index, what is now the portfolio delta? What is the portfolio's 1% and 5% one-day VaR?
Call the portfolio VaR found above dP and use the correlation model to find that the correlation of dP and dM (the market return) to be . So with the beta as rho we need to find the Bl-S-M value of the index call, which is 11.90 each (1190 since each is 100 times the index) so $1,190,000. The delta for these calls is 0.4461 so 44,6100 in total – this is . Put this into the formula above to find that = $139,178.
- Assignment Question 22.28 in Hull
The 3-year corporate bond with yield of 5% implies that its price is the discounted present value of the cash flows, with discount rate of 5%, so its price is 105.33. The riskfree bond has present value of 108.28. So this implies a present discounted value of 2.95 in expected losses from default over the 3-year bond life. With a constant default probability, Q, that recovers $45, we figure that the present value of the losses is 347.69Q. Set this equal to 2.95 and find Q=0.0085.
- Assignment Question 23.28 in Hull
See the spreadsheet. The 2.5% spread, using a 40% recovery rate, implies a 4.16% default probability. This implies a 263-bp spread for the CDS. If the CDS cost 150 bps then it is cheap insurance; if it costs 300 bps then it is overly priced. Arbitrage could be difficult because of the asymmetric information