|
Midterm
Exam Possible Solutions K
Foster, Options & Futures, Eco 275, CCNY, Spring 2010 |
|
|
- (10 points) You're
going to buy corn futures; each full-sized contract is 5000 bushels, while
mini-contracts are 1000 bushels (delivered to a few locations in
- How much does
a single full-sized contract cost?
A mini-contract?
A
single full-size contract costs 5000*3.75 = $18,750; a mini-contract costs
$3750.
- Given interest
rates of 2.5%, what range of prices would not present arbitrage
opportunities?
Spot
prices and futures prices should be linked; F0 = S0erT so the spot
price should be 3.7188, otherwise there are arbitrage opportunities.
- Initial margin
is $1350 so assume you buy one contract with only that margin
amount. The maintenance margin is
$1000. How large of a price
decline would trigger a margin call?
Each
penny of price decline costs $50 for the whole contract so the price could decline
only 7 cents before there is a margin call.
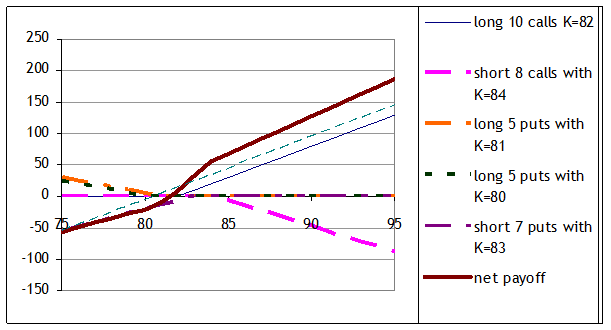
- (20 points) You
have a portfolio with calls and puts on oil contracts; all of these
options are European. The current
oil price is $80.68/barrel. You are
long 10 calls with strike of 82 and short 8 calls with strike of 84. (Contract size is 1000 barrels in each;
each option brings the right but not the obligation to buy 1000
barrels.) You own 5 puts with
strike price of 81 and 5 puts with strike price of 80. You are short 7 puts with strike prices
of 83.
- Draw the
payoff graph for your portfolio.

- If you bought
10,000 barrels (or 10 contracts) at a price of 80.50/barrel, how would
the payoff graph change?
- (25 points) You
are considering whether to buy an at-the-money European put, expiring in a
month, on a stock that is currently worth 50. After one month assume the stock will be
worth 55 or 45. The risk-free rate
is 2%.
- What are the
risk-neutral probabilities of the stock rising or falling?
The
risk-neutral probabilities, p and (1 – p), must satisfy ![]() so substitute in
r=0.02 and T=1/12 and solve:
so substitute in
r=0.02 and T=1/12 and solve: 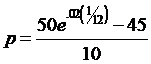 so p=.50834 and (1 –
p) = .49166.
so p=.50834 and (1 –
p) = .49166.
- What is the
delta for the put?
Use
- What is the
fair value of the put?
Use
the risk-neutral probabilities to find the put value is ![]() = 2.4542.
= 2.4542.
Or
use Hull's Δ-method to find that the riskless portfolio, which has current
value ![]() = -27.4542, is
composed of Δ units of stock and one short put, 50Δ – put, so the put
price is 27.4542 – 25 = 2.4542 – the same answer as with the probabilities.
= -27.4542, is
composed of Δ units of stock and one short put, 50Δ – put, so the put
price is 27.4542 – 25 = 2.4542 – the same answer as with the probabilities.
- (20 points) The
Greek government has seen prices of its bonds fall dramatically. Consider two (fictitious) bonds; both
pay 100 semi-annually. One is an
on-the-run 5 year bond with just 1.5 years remaining (3 remaining
payments); the other matures in 3 years and also pays 100 semi-annually.
- As of
September 2009, the first bond traded at a price of 292.65. The second bond traded at a price of
662.61. Assuming discrete
semi-annual compounding, what was the implied zero rate for 1.5 years?
Find
the value of r that solves  , which is R=2.5% (you can solve this by guessing a couple
rates – the graph gives clues about the likely value).
, which is R=2.5% (you can solve this by guessing a couple
rates – the graph gives clues about the likely value).
- What was the
forward rate from 1.5 to 3 years?
Now find the value of the rate
that solves  -- my typo had 662.61
not 562.61 (which would give 3.75%).
From the correct number you'd find a forward rate of 5%.
-- my typo had 662.61
not 562.61 (which would give 3.75%).
From the correct number you'd find a forward rate of 5%.
- By March 2010
(6 months late),
Now
solve 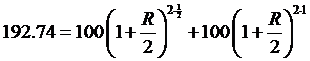 so R=5%.
- What is the
forward rate from 1 to 2.5 years?
Solve
 so R=5.2% so the
forward rate is 5.4%.
so R=5.2% so the
forward rate is 5.4%.
- Actual Greek
bonds saw the yield curve compact, as short rates rose substantially
while longer yields rose by less; the graph below (data from Greek
Central Bank) shows yields on 3 – 30 year bonds. Explain why this might be so.
Answers
will vary; somehow explain theories of yield curve slope.
- How has the
duration of these bonds changed?
You
can calculate up to eight separate durations/modified durations; the table
summarizes them:
|
|
maturity 1.5 or 1 yr |
maturity 3 or 2.5 yr |
||
|
|
R old |
R new |
R old |
R new |
|
duration |
0.996 |
0.747 |
1.723 |
1.474 |
|
modified duration |
0.996 |
0.747 |
1.723 |
1.474 |