|
Overview of ATUS Econ 29000 Kevin R Foster, CCNY Spring 2011 |
|
|
We will use data from the "American Time Use Survey," or ATUS. This asks respondents to carefully list how they spent each hour of their time during the day; it's a tremendous resource. The survey data is collected by the US Bureau of Labor Statistics (BLS), a US government agency. You can find more information about it here, http://www.bls.gov/tus/.
The dataset has information on 98,778 people interviewed from 2003-2009. This gives you a ton of information – we really need to work to get even the simplest information from it.
We will work on this data using PASW/SPSS. For an overview of the basics of how to use that program, find the separate class document online.
The dataset is ready to use in SPSS/PASW. Download it from the class's Blackboard page onto your computer desktop. If it is zipped, then unzip it. Remember that if you're in the computer lab, just double-clicking on the SPSS file may not automatically start up SPSS; you'll get some error code. So use the Start bar to find SPSS and start it that way. Then open up your dataset once the program has loaded.
The ATUS has data telling how many minutes each person spent on various activities during the day. These are created from detailed logbooks that each person kept, recording their activities throughout the day.
They recorded how much time was spent with family members, with spouse, sleeping, watching TV, doing household chores, working, commuting, going to church/religious ceremonies, volunteering – there are hundreds of specific data items!
The NY Times had this graphic showing the different uses of time during the day [here http://www.nytimes.com/interactive/2009/07/31/business/20080801-metrics-graphic.html is the full interactive chart where you can compare the time use patterns of men and women, employed and unemployed, and other groups – a great way to lose an evening! The article is here http://www.nytimes.com/2009/08/02/business/02metrics.html?_r=2 ]
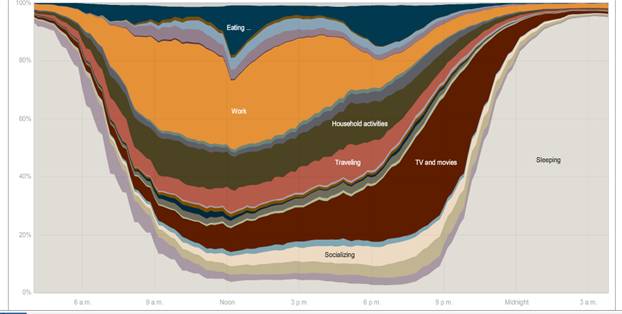
To most effectively use this dataset you will have to do some initial work. The broad categories in the graphic such as "Work" or "TV and movies" are not given in the initial data. Rather you need to add up the total time spent by people in a variety of activities.
When doing this it is helpful to understand the ATUS classification system, where additional numbers at the right indicated additional specificity. The first two digits give generic broad categories. The general classification T05 refers to time spent doing things related to work. T0501 is specific to actual work; T050101 is "Work, main job" then T050102 is "Work, other job," T050103 is "Security Procedures related to work," and T050189 is "Working, Not Elsewhere Classified," abbreviated as n.e.c. (usually if the final digit is a nine then that means that it is a miscellaneous or catch-all category). Then there are activities that are strongly related to work, that a person might not do if they were not working at a particular job – like taking a client out to dinner or golfing. These get their own classification codes, T050201, T050202, T050203, T050204, or T050289. The list continues; there are "Income-generating hobbies, crafts, and food" and "Job interviewing" and "Job search activities." These have other classifications beginning with T05 to indicate that they are work-related.
So for instance, to create a variable, "Time Spent Working" that we might label "T_work," you would have to add up T050101, T050102, T050103, T050189, T050201, T050202, T050203, T050204, T050289, T050301, T050302, T050303, T050304, T050389, T050403, T050404, T050405, T050481, T050499, and T059999. You might want to add in "Travel related to working" down in T180501. (No sane human would remember all these codings but you'd look at the "Labels" in SPSS and create a new variable.) It's tedious but not difficult in any way. The way to create a new variable is described in the separate lecture note on "Using PASW/SPSS."
Some variables are even more detailed – playing sports is broken down into aerobics, baseball, basketball, biking, billiards, boating, bowling, ... all the way to wrestling, yoga, and "Not Elsewhere Classified" for those with really obscure interests. Then there are similar breakdowns for watching those sports. Most people will have a zero value for most of these but they're important for a few people.
You can imagine that different researchers, exploring different questions, could want different aggregates. So the basic data has a very fine classification which you can add up, however you want.
Basics of government race/ethnicity
classification
The US government asks questions about people's race and ethnicity. These categories are social constructs, which is a fancy way of pointing out that they are not based on hard science but on people's own views of themselves (influenced by how people think that other people think of them...). Currently the standard classification asks people separately about their "race" and "ethnicity" where people can pick labels from each category in any combination.
The "race" categories that are listed are: "White only," "Black only," "American Indian, Alaskan Native only," "Asian only," "Hawaiian-Pacific Islander only," "White-Black," "White-American Indian," "White-Asian," "White-Hawaiian," "Black-American Indian," "Black-Asian," "Black-Hawaiian," "American Indian-Asian," "Asian-Hawaiian," "White-Black-American Indian," "White-American Indian-Asian," "White-Asian-Hawaiian," "White-Black-American Indian-Asian," "2 or 3 races," "4 or 5 races," or "Other."
These are a peculiar combination of very general (well over 40% of the world's population is "Asian") and very specific ("Hawaiian-Pacific Islander") representing a peculiar history of popular attitudes in the US. Only in the 2000 Census did they start to classify people in mixed races. (The Census is only beginning to use "African-American" instead of "Black.") If you were to go back to historical US Censuses from more than a century ago, you would find that the category "race" included separate entries for Irish and French and various other nationalities. Stephen J Gould has a great book, The Mismeasure of Man, discussing how early scientific classifications of humans tried to "prove" which nationalities/races/groups were the smartest.
Note that "Hispanic" is not "race" but rather ethnicity (includes various other labels such as Spanish, Latino, etc.). So a respondent could choose "Hispanic" and any race category – some choose "White," some choose "Black," some might be combined with any other of those complicated racial categories.
What that means, specifically for us reporting statistics on a dataset like this, is that we can easily find that, of the 98,778 people in the ATUS dataset, 82.4% report their race as "White only" and 12.6 as "Black only" (2.8% report Asian and the remainder are each less than 1%). Then 12.6% classify their ethnicity as Hispanic and 87.4% are not Hispanic. Can we just take the 82.4% White, subtract the 12.6% Hispanic to say that 69.8% are "non-Hispanic White"? NO! Because that assumes that all of the people who self-classified as Hispanic were also self-classified as "White only" which is not true. We would have to create a new variable for non-Hispanic White to find that proportion.
How can we do that with SPSS? On the drop-down menu find "Transform" then "Compute Variable" then in the dialog box, give the new variable (it calls it the "Target Variable") a name (e.g. "nonHispWhite") and a Numeric Expression, for example here " (PTDTRACE=1) & (PEHSPNON=2) ". The first expression evaluates, for each case, whether the variable, "PTDTRACE" which is the variable coding race, has a value of 1 (which corresponds to the label "White only"). If it equals 1 then the expression is True, which is coded as 1; if PTDTRACE does not equal 1 then the expression is False, coded as zero. The second expression evaluates if "PHEHSPNON" equals 2 or not. The "&" sign in the middle evaluates if both expressions are true or not. When we run this classification, we find that 70.6% are non-Hispanic white, a difference of 0.8% from the simplistic earlier answer. The difference isn't huge in aggregate but can become large in sub-groups so we should be careful from the beginning.
All of these racial categories might make some people uneasy: is the government somehow encouraging racism by recognizing these classifications? Other governments don't collect race data; for example in France every person is officially "French" with no further distinction necessary. But that doesn't mean that there are no differences, only that the government doesn't choose to measure any of these differences. In the US, government agencies such as the Census and BLS don't collect data on religion, which means that we can't answer certain questions.