|
Example of Analysis with SPSS Econ 29000 Kevin R Foster, CCNY Spring 2011 |
|
|
I will do an example to make the previous presentation, on Using SPSS, a bit clearer. We will look at how much time male and female college students spend watching TV. (I hope that for you the answer is "zero"!)
Open the ATUS 2003-2009 dataset.
First use "Transform \ Compute ..." to create a new variable, tv_time, which we set equal to the sum of T120303, watching non-religious TV, and T120304, watching religious TV. (Should we include T120308, playing computer games?)
Use "Transform \ Compute ..." to create another variable, educ_time, which is the sum of time spent doing things relevant to education, T060101 + T060102 + T060103 + T060104 + T060199 + T060301 + T060302 + T060303 + T060399. (Time spent in class and time spent doing homework, mainly.)
I'll also create "ratio_TV_study" that is the ratio of TV_time to educ_time.
Run "Analyze \ Descriptive Statistics \ Descriptives ..." to check that these seem sensible:
|
Descriptive Statistics |
|||||
|
|
N |
Minimum |
Maximum |
Mean |
Std. Deviation |
|
tv_time |
98778 |
.00 |
1417.00 |
165.2058 |
168.33963 |
|
educ_time |
98778 |
.00 |
1090.00 |
16.3008 |
79.47292 |
|
ratio_TV_study |
5974 |
.00 |
120.00 |
1.0450 |
3.00829 |
|
Valid N (listwise) |
5974 |
|
|
|
|
Note that the average for "educ_time" is low because most non-students will report zero time spent studying. All of those zero values returned errors when computing the ratio, so this has only 5974 reports of people with more than zero time studying.
Use "Data \ Select Cases ... " to select only college students (those for whom the 13th variable, TESCHLVL, is equal to 2).
Now to compare men and women I will use "Data \ Split File ... " to split into two groups and compare them – the program will do this automatically for all subsequent analysis.
This Split File screen is:
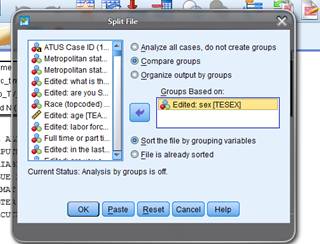
Now when I run the same "Descriptives" as before, this time I get the output subdivided:
|
Descriptive Statistics |
||||||
|
Edited: sex |
N |
Minimum |
Maximum |
Mean |
Std. Deviation |
|
|
= "Male" |
tv_time |
2018 |
.00 |
860.00 |
127.1665 |
138.93259 |
|
educ_time |
2018 |
.00 |
1051.00 |
112.6056 |
186.01012 |
|
|
ratio_TV_study |
784 |
.00 |
75.00 |
.8390 |
3.02939 |
|
|
Valid N (listwise) |
784 |
|
|
|
|
|
|
= "Female" |
tv_time |
3581 |
.00 |
1100.00 |
111.4739 |
124.86338 |
|
educ_time |
3581 |
.00 |
1090.00 |
104.8176 |
173.84758 |
|
|
ratio_TV_study |
1450 |
.00 |
120.00 |
.9117 |
4.04470 |
|
|
Valid N (listwise) |
1450 |
|
|
|
|
|
This shows that male college students watch an average of 127 minutes of TV per day and devote an average of 113 minutes to school; females watch 111 minutes of TV and devote 105 minutes to their studies. Men watch more TV but also spend a bit more time on school so the average ratio of time spent watching TV to time spent on school is .91 for women and .84 for men.
Finally I'll show a graph,
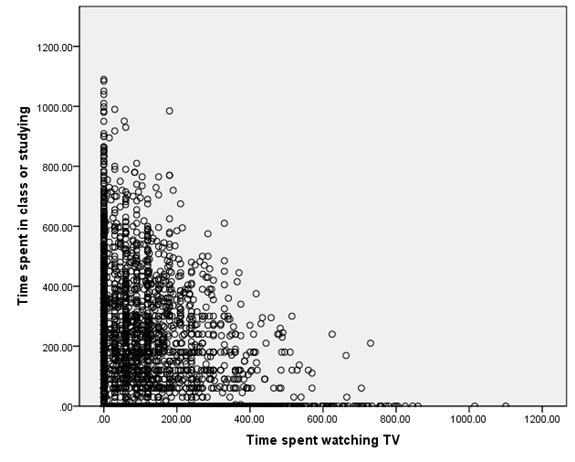
Note that there are quite a number of respondents who spent zero time studying or zero time watching TV. We would expect a downward relation since it is like a budget set: the more time is spent watching TV, the less is available to do anything else.
To get this graph, choose "Graphs \ Chart Builder ..." and drag the elements to where you want them, like this,
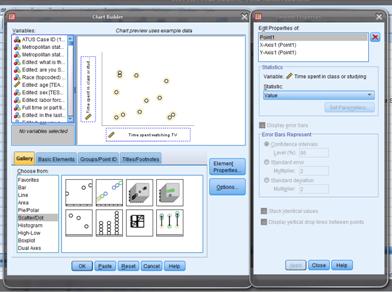
This is the first type of "Scatter/Dot" graph.
For this graph I removed the split, since it didn't look like there were significant differences between men and women in that regard – the same "Data \ Split File ... " but now "Analyze all cases."
I can create
a histogram of the ratio of time spent watching TV to time spent studying, 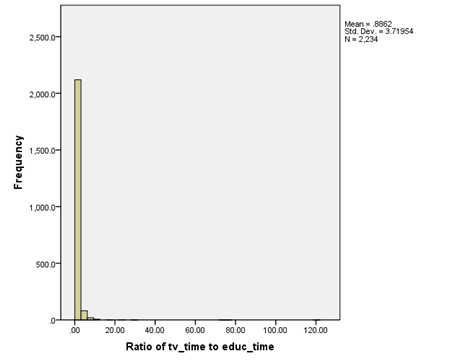
But this isn't much use since it's dominated by the few extreme values of people who spent 100 or more times as many minutes in TV as studying. So this histogram,
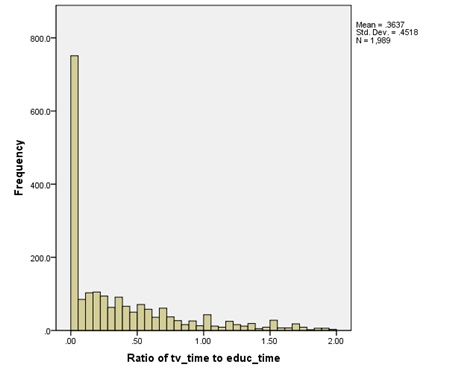
plots only those with a ratio less than 2.
(To make this chart, I used "Graphs \ Chart Builder ..." and then chose "Bar." When you put in just one variable on the x-axis it assumes you want a Histogram.)
Now you can go on to do your own analysis, maybe by race/ethnicity? Or go back and add in video game playing? Of the people who didn't watch TV, were there a larger fraction of men or women?