|
Possible Solutions for Homework 2 Econ 29000 Kevin R Foster, CCNY |
|
|
1.
What are the names of the people
in your study group?
2.
Use PASW/SPSS to open the ATUS
dataset (refer to online notes on PASW/SPSS and ATUS). Create a new variable, time spent sleeping,
that includes sleeplessness and sleep, n.e.c.; you
might as well change the units to hours since that's easier to understand (i.e.
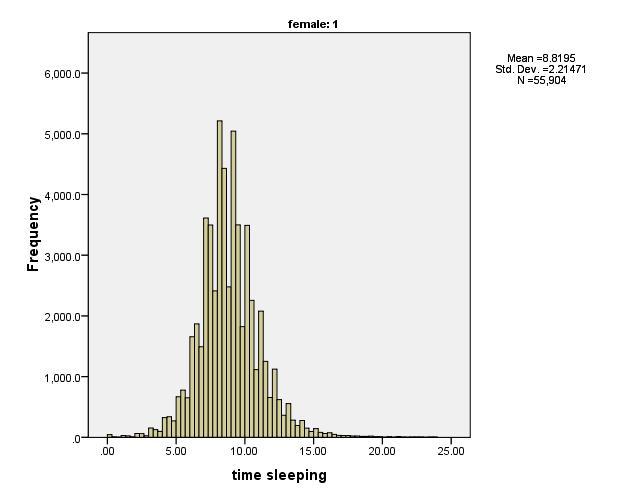
divide by 60). Create histograms that
show the hours of sleep of adult men and
women. Explain what these show. (You may want to further examine
subcategories; go ahead!)
A look at the percentiles is revealing:
|
Percentile |
Male |
Female |
|
5 |
5.3 |
5.5 |
|
10 |
6.0 |
6.4 |
|
25 |
7.3 |
7.5 |
|
50 |
8.5 |
8.7 |
|
75 |
10.0 |
10.0 |
|
90 |
11.5 |
11.5 |
|
95 |
12.5 |
12.5 |
So it looks like a lot of the variation is in the left tail: men are more likely to forego sleep than women, but the upper percentiles get about as much sleep. These histograms are:
|
Men
|
Women
|
The SPSS output is an appendix – it lists the coding used as well, so you can follow along.
3.
Using the ATUS, create a
variable, "Time Spent Working," labeled "T_work,"
that is the sum of T050101, T050102, T050103, T050189, T050201, T050202,
T050203, T050204, T050289, T050301, T050302, T050303, T050304, T050389, T050403,
T050404, T050405, T050481,
T050499, T059999, and T180501.
Create a scatter plot with time working on the horizontal axis and time
sleeping on the vertical. Do you see any
relationship? Would you expect to see
one? Is there a different relationship,
for men and women? Old and young? African-American, Hispanic, Asian,
white? Choose any interesting pair.
The correlation between time spent working and sleeping is -.357 for the whole sample of 98,778 people; if we restrict attention to only those 38,366 who work (spend non-zero time working), the correlation is -.360. Of those who work, I further divide the sample into those with children in the household and those without; the correlation of time working and sleeping is -.361 vs. -.359 – no real difference.
4.
Compute the mean and median for
hours of sleep between men and women (#2 above) and then hours of work between
your chosen pair in #3 above. Discuss
the marginal information contributed by these estimates. Find means and medians for sub-groups, based
on age (at least 18-35, 36-55, 56+; a finer grid could be more useful); how do
these contribute to your understanding of the variation in the data?
The time spent working and sleeping is shown in the table below, subdivided between those with children and without, for men and women in different age groups (note that people under 18 are not in the data unless they have children themselves):
|
No kids |
with kids |
||||||||||
|
women |
men |
women |
men |
women |
men |
women |
men |
||||
|
time working |
time sleeping |
time working |
time sleeping |
||||||||
|
under 18 |
under 18 |
4.7 |
4.8 |
9.2 |
9.1 |
||||||
|
4.8 |
4.5 |
9.0 |
9.0 |
||||||||
|
438 |
472 |
438 |
472 |
||||||||
|
Mean |
18-35 |
7.3 |
8.0 |
8.3 |
8.1 |
18-35 |
7.0 |
8.1 |
8.1 |
7.9 |
|
|
Median |
8.1 |
8.5 |
8.3 |
8.0 |
7.8 |
8.7 |
8.0 |
8.0 |
|||
|
N |
1832 |
2306 |
1832 |
2306 |
3357 |
2839 |
3357 |
2839 |
|||
|
Mean |
35-55 |
7.6 |
8.2 |
7.9 |
7.8 |
35-55 |
6.8 |
8.1 |
7.8 |
7.7 |
|
|
Median |
8.3 |
8.8 |
7.8 |
7.7 |
7.8 |
8.9 |
7.8 |
7.6 |
|||
|
N |
3734 |
4002 |
3734 |
4002 |
5867 |
6516 |
5867 |
6516 |
|||
|
Mean |
55 + |
6.9 |
7.5 |
7.9 |
7.8 |
55 + |
7.1 |
7.8 |
7.7 |
7.7 |
|
|
Median |
7.8 |
8.2 |
7.8 |
7.8 |
7.9 |
8.5 |
7.5 |
7.7 |
|||
|
N |
3142 |
3019 |
3142 |
3019 |
341 |
501 |
341 |
501 |
|||
(Note that this is in a different format from that which SPSS delivers – to make it easier to see and understand.)
The
SPSS output is below. I made age/gender
categories by creating a new variable, age_gendr_categories=female *
(1*(TEAGE < 18) + 2*((TEAGE >= 18) & (TEAGE < 35)) + 3*((TEAGE
>= 35) & (TEAGE < 55)) + 4*(TEAGE >= 55)) + ( ~ female) *
(5*(TEAGE < 18) + 6*((TEAGE >= 18) & (TEAGE < 35)) + 7*((TEAGE
>= 35) & (TEAGE < 55)) + 8*(TEAGE = 55)).
GET
FILE='C:\Users\kevin\Documents\Eco 29000 Statistics Spring 2011\data to be used\ATUS_2003_2009\ATUS_2003-09_for class1.sav'.
DATASET ACTIVATE DataSet2.
SORT CASES BY female.
SPLIT FILE LAYERED BY female.
* Chart Builder.
GGRAPH
/GRAPHDATASET NAME="graphdataset" VARIABLES=t_sleep MISSING=LISTWISE REPORTMISSING=NO
/GRAPHSPEC SOURCE=INLINE.
BEGIN GPL
SOURCE: s=userSource(id("graphdataset"))
DATA: t_sleep=col(source(s), name("t_sleep"))
GUIDE: axis(dim(1), label("time sleeping"))
GUIDE: axis(dim(2), label("Frequency"))
ELEMENT: interval(position(summary.count(bin.rect(t_sleep))), shape.interior(shape.square))
END GPL.
GGraph
[DataSet2] C:\Users\kevin\Documents\Eco 29000 Statistics Spring 2011\data to be used\ATUS_2003_2009\ATUS_2003-09_for class1.sav

FREQUENCIES VARIABLES=t_sleep /FORMAT=NOTABLE /NTILES=4 /PERCENTILES=5.0 10.0 90.0 95.0 /STATISTICS=MODE /ORDER=ANALYSIS.
Frequencies
[DataSet2] C:\Users\kevin\Documents\Eco 29000 Statistics Spring 2011\data to be used\ATUS_2003_2009\ATUS_2003-09_for class1.sav
|
Statistics |
|||
|
time sleeping |
|||
|
.00 |
N |
Valid |
42874 |
|
Missing |
0 |
||
|
|
Mode |
8.00 |
|
|
Percentiles |
5 |
5.2667 |
|
|
10 |
6.0000 |
||
|
25 |
7.2500 |
||
|
50 |
8.5000 |
||
|
75 |
10.0000 |
||
|
90 |
11.5000 |
||
|
95 |
12.5000 |
||
|
1.00 |
N |
Valid |
55904 |
|
Missing |
0 |
||
|
|
Mode |
9.00 |
|
|
Percentiles |
5 |
5.5000 |
|
|
10 |
6.4167 |
||
|
25 |
7.5000 |
||
|
50 |
8.6667 |
||
|
75 |
10.0000 |
||
|
90 |
11.5000 |
||
|
95 |
12.5000 |
||
SPLIT FILE OFF. CORRELATIONS /VARIABLES=T_work t_sleep /PRINT=TWOTAIL NOSIG /STATISTICS DESCRIPTIVES /MISSING=PAIRWISE.
Correlations
[DataSet2] C:\Users\kevin\Documents\Eco 29000 Statistics Spring 2011\data to be used\ATUS_2003_2009\ATUS_2003-09_for class1.sav
|
Descriptive Statistics |
|||
|
|
Mean |
Std. Deviation |
N |
|
T_work |
2.9068 |
4.31231 |
98778 |
|
time sleeping |
8.7557 |
2.25488 |
98778 |
|
Correlations |
|||
|
|
|
T_work |
time sleeping |
|
T_work |
Pearson Correlation |
1 |
-.357** |
|
Sig. (2-tailed) |
|
.000 |
|
|
N |
98778 |
98778 |
|
|
time sleeping |
Pearson Correlation |
-.357** |
1 |
|
Sig. (2-tailed) |
.000 |
|
|
|
N |
98778 |
98778 |
|
|
**. Correlation is significant at the 0.01
level (2-tailed). |
|||
USE ALL. COMPUTE filter_$=(T_work>0). VARIABLE LABEL filter_$ 'T_work>0 (FILTER)'. VALUE LABELS filter_$ 0 'Not Selected' 1 'Selected'. FORMAT filter_$ (f1.0). FILTER BY filter_$. EXECUTE. CORRELATIONS /VARIABLES=T_work t_sleep /PRINT=TWOTAIL NOSIG /STATISTICS DESCRIPTIVES /MISSING=PAIRWISE.
Correlations
|
Descriptive
Statistics |
|||
|
|
Mean |
Std. Deviation |
N |
|
T_work |
7.4839 |
3.69097 |
38366 |
|
time sleeping |
7.8962 |
1.89544 |
38366 |
|
Correlations |
|||
|
|
|
T_work |
time sleeping |
|
T_work |
Pearson Correlation |
1 |
-.360** |
|
Sig. (2-tailed) |
|
.000 |
|
|
N |
38366 |
38366 |
|
|
time sleeping |
Pearson Correlation |
-.360** |
1 |
|
Sig. (2-tailed) |
.000 |
|
|
|
N |
38366 |
38366 |
|
|
**. Correlation is significant at the 0.01
level (2-tailed). |
|||
COMPUTE has_kids=(TRCHILDNUM > 0). EXECUTE. SORT CASES BY has_kids. SPLIT FILE LAYERED BY has_kids. CORRELATIONS /VARIABLES=T_work t_sleep /PRINT=TWOTAIL NOSIG /STATISTICS DESCRIPTIVES /MISSING=PAIRWISE.
Correlations
|
Descriptive
Statistics |
||||
|
has_kids |
Mean |
Std. Deviation |
N |
|
|
.00 |
T_work |
7.6111 |
3.65303 |
18035 |
|
time sleeping |
7.9015 |
1.93092 |
18035 |
|
|
1.00 |
T_work |
7.3710 |
3.72076 |
20331 |
|
time sleeping |
7.8915 |
1.86344 |
20331 |
|
|
Correlations |
||||
|
has_kids |
T_work |
time sleeping |
||
|
.00 |
T_work |
Pearson Correlation |
1 |
-.361** |
|
Sig. (2-tailed) |
|
.000 |
||
|
N |
18035 |
18035 |
||
|
time sleeping |
Pearson Correlation |
-.361** |
1 |
|
|
Sig. (2-tailed) |
.000 |
|
||
|
N |
18035 |
18035 |
||
|
1.00 |
T_work |
Pearson Correlation |
1 |
-.359** |
|
Sig. (2-tailed) |
|
.000 |
||
|
N |
20331 |
20331 |
||
|
time sleeping |
Pearson Correlation |
-.359** |
1 |
|
|
Sig. (2-tailed) |
.000 |
|
||
|
N |
20331 |
20331 |
||
|
**. Correlation is significant at the 0.01
level (2-tailed). |
||||
COMPUTE age_gendr_categories=female * (1*(TEAGE < 18) + 2*((TEAGE >= 18) & (TEAGE < 35)) + 3*((TEAGE >= 35) & (TEAGE < 55)) + 4*(TEA
GE >= 55)) + ( ~ female) * (5*(TEAGE < 18) + 6*((TEAGE >= 18) & (TEAGE < 35)) + 7*((TEAGE >= 35) & (TEAGE < 55)) + 8*(TEAGE
>= 55)).
EXECUTE.
EXAMINE VARIABLES=T_work t_sleep BY age_gendr_categories
/PLOT NONE
/STATISTICS DESCRIPTIVES
/CINTERVAL 95
/MISSING LISTWISE
/NOTOTAL.
EXAMINE VARIABLES=T_work t_sleep BY age_gendr_categories /PLOT NONE /STATISTICS DESCRIPTIVES /CINTERVAL 95 /MISSING LISTWISE /NOTOTAL.
Explore
gender
and age categories
|
Case Processing
Summary |
||||||
|
has_kids |
gender and age categories |
Cases |
||||
|
Valid |
Missing |
|||||
|
N |
Percent |
N |
Percent |
|||
|
.00 |
T_work |
female 18-35 |
1832 |
100.0% |
0 |
.0% |
|
female 35-55 |
3734 |
100.0% |
0 |
.0% |
||
|
female over 55 |
3142 |
100.0% |
0 |
.0% |
||
|
male 18-35 |
2306 |
100.0% |
0 |
.0% |
||
|
male 35-55 |
4002 |
100.0% |
0 |
.0% |
||
|
male over 55 |
3019 |
100.0% |
0 |
.0% |
||
|
time sleeping |
female 18-35 |
1832 |
100.0% |
0 |
.0% |
|
|
female 35-55 |
3734 |
100.0% |
0 |
.0% |
||
|
female over 55 |
3142 |
100.0% |
0 |
.0% |
||
|
male 18-35 |
2306 |
100.0% |
0 |
.0% |
||
|
male 35-55 |
4002 |
100.0% |
0 |
.0% |
||
|
male over 55 |
3019 |
100.0% |
0 |
.0% |
||
|
1.00 |
T_work |
female 18-35 |
3357 |
100.0% |
0 |
.0% |
|
female 35-55 |
5867 |
100.0% |
0 |
.0% |
||
|
female over 55 |
341 |
100.0% |
0 |
.0% |
||
|
male 18-35 |
2839 |
100.0% |
0 |
.0% |
||
|
male 35-55 |
6516 |
100.0% |
0 |
.0% |
||
|
male over 55 |
501 |
100.0% |
0 |
.0% |
||
|
female under 18 |
438 |
100.0% |
0 |
.0% |
||
|
male under 18 |
472 |
100.0% |
0 |
.0% |
||
|
time sleeping |
female 18-35 |
3357 |
100.0% |
0 |
.0% |
|
|
female 35-55 |
5867 |
100.0% |
0 |
.0% |
||
|
female over 55 |
341 |
100.0% |
0 |
.0% |
||
|
male 18-35 |
2839 |
100.0% |
0 |
.0% |
||
|
male 35-55 |
6516 |
100.0% |
0 |
.0% |
||
|
male over 55 |
501 |
100.0% |
0 |
.0% |
||
|
female under 18 |
438 |
100.0% |
0 |
.0% |
||
|
male under 18 |
472 |
100.0% |
0 |
.0% |
||
|
Case Processing
Summary |
||||
|
has_kids |
gender and age categories |
Cases |
||
|
Total |
||||
|
N |
Percent |
|||
|
.00 |
T_work |
female 18-35 |
1832 |
100.0% |
|
female 35-55 |
3734 |
100.0% |
||
|
female over 55 |
3142 |
100.0% |
||
|
male 18-35 |
2306 |
100.0% |
||
|
male 35-55 |
4002 |
100.0% |
||
|
male over 55 |
3019 |
100.0% |
||
|
time sleeping |
female 18-35 |
1832 |
100.0% |
|
|
female 35-55 |
3734 |
100.0% |
||
|
female over 55 |
3142 |
100.0% |
||
|
male 18-35 |
2306 |
100.0% |
||
|
male 35-55 |
4002 |
100.0% |
||
|
male over 55 |
3019 |
100.0% |
||
|
1.00 |
T_work |
female 18-35 |
3357 |
100.0% |
|
female 35-55 |
5867 |
100.0% |
||
|
female over 55 |
341 |
100.0% |
||
|
male 18-35 |
2839 |
100.0% |
||
|
male 35-55 |
6516 |
100.0% |
||
|
male over 55 |
501 |
100.0% |
||
|
female under 18 |
438 |
100.0% |
||
|
male under 18 |
472 |
100.0% |
||
|
time sleeping |
female 18-35 |
3357 |
100.0% |
|
|
female 35-55 |
5867 |
100.0% |
||
|
female over 55 |
341 |
100.0% |
||
|
male 18-35 |
2839 |
100.0% |
||
|
male 35-55 |
6516 |
100.0% |
||
|
male over 55 |
501 |
100.0% |
||
|
female under 18 |
438 |
100.0% |
||
|
male under 18 |
472 |
100.0% |
||
|
Descriptives |
||||||
|
has_kids |
gender and age categories |
Statistic |
Std. Error |
|||
|
.00 |
T_work |
female 18-35 |
|
Mean |
7.3170 |
.07927 |
|
95% Confidence Interval for Mean |
Lower Bound |
7.1615 |
|
|||
|
Upper Bound |
7.4725 |
|
||||
|
|
5% Trimmed Mean |
7.3470 |
|
|||
|
Median |
8.0750 |
|
||||
|
Variance |
11.511 |
|
||||
|
Std. Deviation |
3.39273 |
|
||||
|
Minimum |
.02 |
|
||||
|
Maximum |
20.25 |
|
||||
|
Range |
20.23 |
|
||||
|
Interquartile Range |
4.21 |
|
||||
|
Skewness |
-.345 |
.057 |
||||
|
Kurtosis |
-.125 |
.114 |
||||
|
female 35-55 |
|
Mean |
7.6494 |
.05811 |
||
|
95% Confidence Interval for Mean |
Lower Bound |
7.5355 |
|
|||
|
Upper Bound |
7.7633 |
|
||||
|
|
5% Trimmed Mean |
7.6808 |
|
|||
|
Median |
8.3333 |
|
||||
|
Variance |
12.608 |
|
||||
|
Std. Deviation |
3.55074 |
|
||||
|
Minimum |
.02 |
|
||||
|
Maximum |
23.25 |
|
||||
|
Range |
23.23 |
|
||||
|
Interquartile Range |
3.83 |
|
||||
|
Skewness |
-.399 |
.040 |
||||
|
Kurtosis |
.111 |
.080 |
||||
|
female over 55 |
|
Mean |
6.8725 |
.06266 |
||
|
95% Confidence Interval for Mean |
Lower Bound |
6.7496 |
|
|||
|
Upper Bound |
6.9953 |
|
||||
|
|
5% Trimmed Mean |
6.8643 |
|
|||
|
Median |
7.7500 |
|
||||
|
Variance |
12.335 |
|
||||
|
Std. Deviation |
3.51207 |
|
||||
|
Minimum |
.02 |
|
||||
|
Maximum |
20.07 |
|
||||
|
Range |
20.05 |
|
||||
|
Interquartile Range |
4.83 |
|
||||
|
Skewness |
-.222 |
.044 |
||||
|
Kurtosis |
-.427 |
.087 |
||||
|
male 18-35 |
|
Mean |
7.9581 |
.07522 |
||
|
95% Confidence Interval for Mean |
Lower Bound |
7.8106 |
|
|||
|
Upper Bound |
8.1056 |
|
||||
|
|
5% Trimmed Mean |
7.9819 |
|
|||
|
Median |
8.5000 |
|
||||
|
Variance |
13.048 |
|
||||
|
Std. Deviation |
3.61213 |
|
||||
|
Minimum |
.02 |
|
||||
|
Maximum |
22.75 |
|
||||
|
Range |
22.73 |
|
||||
|
Interquartile Range |
3.83 |
|
||||
|
Skewness |
-.291 |
.051 |
||||
|
Kurtosis |
.393 |
.102 |
||||
|
male 35-55 |
|
Mean |
8.2095 |
.05949 |
||
|
95% Confidence Interval for Mean |
Lower Bound |
8.0929 |
|
|||
|
Upper Bound |
8.3262 |
|
||||
|
|
5% Trimmed Mean |
8.2380 |
|
|||
|
Median |
8.7500 |
|
||||
|
Variance |
14.165 |
|
||||
|
Std. Deviation |
3.76360 |
|
||||
|
Minimum |
.02 |
|
||||
|
Maximum |
23.83 |
|
||||
|
Range |
23.82 |
|
||||
|
Interquartile Range |
3.92 |
|
||||
|
Skewness |
-.329 |
.039 |
||||
|
Kurtosis |
.267 |
.077 |
||||
|
male over 55 |
|
Mean |
7.4528 |
.06899 |
||
|
95% Confidence Interval for Mean |
Lower Bound |
7.3175 |
|
|||
|
Upper Bound |
7.5881 |
|
||||
|
|
5% Trimmed Mean |
7.4443 |
|
|||
|
Median |
8.1667 |
|
||||
|
Variance |
14.368 |
|
||||
|
Std. Deviation |
3.79046 |
|
||||
|
Minimum |
.02 |
|
||||
|
Maximum |
21.33 |
|
||||
|
Range |
21.32 |
|
||||
|
Interquartile Range |
5.33 |
|
||||
|
Skewness |
-.194 |
.045 |
||||
|
Kurtosis |
-.327 |
.089 |
||||
|
time sleeping |
female 18-35 |
|
Mean |
8.2993 |
.04651 |
|
|
95% Confidence Interval for Mean |
Lower Bound |
8.2080 |
|
|||
|
Upper Bound |
8.3905 |
|
||||
|
|
5% Trimmed Mean |
8.2781 |
|
|||
|
Median |
8.2500 |
|
||||
|
Variance |
3.962 |
|
||||
|
Std. Deviation |
1.99055 |
|
||||
|
Minimum |
.67 |
|
||||
|
Maximum |
19.42 |
|
||||
|
Range |
18.75 |
|
||||
|
Interquartile Range |
2.42 |
|
||||
|
Skewness |
.325 |
.057 |
||||
|
Kurtosis |
1.775 |
.114 |
||||
|
female 35-55 |
|
Mean |
7.8518 |
.03144 |
||
|
95% Confidence Interval for Mean |
Lower Bound |
7.7901 |
|
|||
|
Upper Bound |
7.9134 |
|
||||
|
|
5% Trimmed Mean |
7.8223 |
|
|||
|
Median |
7.8250 |
|
||||
|
Variance |
3.691 |
|
||||
|
Std. Deviation |
1.92128 |
|
||||
|
Minimum |
.00 |
|
||||
|
Maximum |
22.33 |
|
||||
|
Range |
22.33 |
|
||||
|
Interquartile Range |
2.18 |
|
||||
|
Skewness |
.469 |
.040 |
||||
|
Kurtosis |
3.362 |
.080 |
||||
|
female over 55 |
|
Mean |
7.8510 |
.03184 |
||
|
95% Confidence Interval for Mean |
Lower Bound |
7.7886 |
|
|||
|
Upper Bound |
7.9135 |
|
||||
|
|
5% Trimmed Mean |
7.8356 |
|
|||
|
Median |
7.8333 |
|
||||
|
Variance |
3.185 |
|
||||
|
Std. Deviation |
1.78469 |
|
||||
|
Minimum |
.00 |
|
||||
|
Maximum |
20.87 |
|
||||
|
Range |
20.87 |
|
||||
|
Interquartile Range |
1.92 |
|
||||
|
Skewness |
.353 |
.044 |
||||
|
Kurtosis |
3.507 |
.087 |
||||
|
male 18-35 |
|
Mean |
8.0730 |
.04757 |
||
|
95% Confidence Interval for Mean |
Lower Bound |
7.9797 |
|
|||
|
Upper Bound |
8.1663 |
|
||||
|
|
5% Trimmed Mean |
8.0676 |
|
|||
|
Median |
8.0000 |
|
||||
|
Variance |
5.219 |
|
||||
|
Std. Deviation |
2.28442 |
|
||||
|
Minimum |
.00 |
|
||||
|
Maximum |
22.65 |
|
||||
|
Range |
22.65 |
|
||||
|
Interquartile Range |
2.55 |
|
||||
|
Skewness |
.150 |
.051 |
||||
|
Kurtosis |
1.817 |
.102 |
||||
|
male 35-55 |
|
Mean |
7.7524 |
.03028 |
||
|
95% Confidence Interval for Mean |
Lower Bound |
7.6930 |
|
|||
|
Upper Bound |
7.8118 |
|
||||
|
|
5% Trimmed Mean |
7.7451 |
|
|||
|
Median |
7.6667 |
|
||||
|
Variance |
3.668 |
|
||||
|
Std. Deviation |
1.91528 |
|
||||
|
Minimum |
.00 |
|
||||
|
Maximum |
21.58 |
|
||||
|
Range |
21.58 |
|
||||
|
Interquartile Range |
2.17 |
|
||||
|
Skewness |
.166 |
.039 |
||||
|
Kurtosis |
2.916 |
.077 |
||||
|
male over 55 |
|
Mean |
7.8410 |
.03146 |
||
|
95% Confidence Interval for Mean |
Lower Bound |
7.7793 |
|
|||
|
Upper Bound |
7.9027 |
|
||||
|
|
5% Trimmed Mean |
7.8284 |
|
|||
|
Median |
7.7833 |
|
||||
|
Variance |
2.988 |
|
||||
|
Std. Deviation |
1.72870 |
|
||||
|
Minimum |
.00 |
|
||||
|
Maximum |
16.08 |
|
||||
|
Range |
16.08 |
|
||||
|
Interquartile Range |
1.83 |
|
||||
|
Skewness |
.056 |
.045 |
||||
|
Kurtosis |
2.035 |
.089 |
||||
|
1.00 |
T_work |
female 18-35 |
|
Mean |
6.9901 |
.05662 |
|
95% Confidence Interval for Mean |
Lower Bound |
6.8791 |
|
|||
|
Upper Bound |
7.1011 |
|
||||
|
|
5% Trimmed Mean |
7.0077 |
|
|||
|
Median |
7.8000 |
|
||||
|
Variance |
10.761 |
|
||||
|
Std. Deviation |
3.28041 |
|
||||
|
Minimum |
.02 |
|
||||
|
Maximum |
23.00 |
|
||||
|
Range |
22.98 |
|
||||
|
Interquartile Range |
4.00 |
|
||||
|
Skewness |
-.323 |
.042 |
||||
|
Kurtosis |
.176 |
.084 |
||||
|
female 35-55 |
|
Mean |
6.8106 |
.04622 |
||
|
95% Confidence Interval for Mean |
Lower Bound |
6.7200 |
|
|||
|
Upper Bound |
6.9013 |
|
||||
|
|
5% Trimmed Mean |
6.8076 |
|
|||
|
Median |
7.7833 |
|
||||
|
Variance |
12.536 |
|
||||
|
Std. Deviation |
3.54064 |
|
||||
|
Minimum |
.02 |
|
||||
|
Maximum |
23.00 |
|
||||
|
Range |
22.98 |
|
||||
|
Interquartile Range |
4.82 |
|
||||
|
Skewness |
-.306 |
.032 |
||||
|
Kurtosis |
-.411 |
.064 |
||||
|
female over 55 |
|
Mean |
7.1221 |
.19016 |
||
|
95% Confidence Interval for Mean |
Lower Bound |
6.7481 |
|
|||
|
Upper Bound |
7.4962 |
|
||||
|
|
5% Trimmed Mean |
7.0883 |
|
|||
|
Median |
7.9333 |
|
||||
|
Variance |
12.331 |
|
||||
|
Std. Deviation |
3.51149 |
|
||||
|
Minimum |
.02 |
|
||||
|
Maximum |
18.67 |
|
||||
|
Range |
18.65 |
|
||||
|
Interquartile Range |
4.34 |
|
||||
|
Skewness |
-.161 |
.132 |
||||
|
Kurtosis |
.014 |
.263 |
||||
|
male 18-35 |
|
Mean |
8.0832 |
.07070 |
||
|
95% Confidence Interval for Mean |
Lower Bound |
7.9445 |
|
|||
|
Upper Bound |
8.2218 |
|
||||
|
|
5% Trimmed Mean |
8.0979 |
|
|||
|
Median |
8.6667 |
|
||||
|
Variance |
14.190 |
|
||||
|
Std. Deviation |
3.76700 |
|
||||
|
Minimum |
.02 |
|
||||
|
Maximum |
22.50 |
|
||||
|
Range |
22.48 |
|
||||
|
Interquartile Range |
4.30 |
|
||||
|
Skewness |
-.280 |
.046 |
||||
|
Kurtosis |
.227 |
.092 |
||||
|
male 35-55 |
|
Mean |
8.1066 |
.04809 |
||
|
95% Confidence Interval for Mean |
Lower Bound |
8.0124 |
|
|||
|
Upper Bound |
8.2009 |
|
||||
|
|
5% Trimmed Mean |
8.1446 |
|
|||
|
Median |
8.8833 |
|
||||
|
Variance |
15.066 |
|
||||
|
Std. Deviation |
3.88152 |
|
||||
|
Minimum |
.02 |
|
||||
|
Maximum |
22.50 |
|
||||
|
Range |
22.48 |
|
||||
|
Interquartile Range |
4.25 |
|
||||
|
Skewness |
-.449 |
.030 |
||||
|
Kurtosis |
-.102 |
.061 |
||||
|
male over 55 |
|
Mean |
7.7798 |
.16914 |
||
|
95% Confidence Interval for Mean |
Lower Bound |
7.4475 |
|
|||
|
Upper Bound |
8.1122 |
|
||||
|
|
5% Trimmed Mean |
7.8205 |
|
|||
|
Median |
8.5000 |
|
||||
|
Variance |
14.333 |
|
||||
|
Std. Deviation |
3.78593 |
|
||||
|
Minimum |
.02 |
|
||||
|
Maximum |
17.92 |
|
||||
|
Range |
17.90 |
|
||||
|
Interquartile Range |
4.99 |
|
||||
|
Skewness |
-.415 |
.109 |
||||
|
Kurtosis |
-.436 |
.218 |
||||
|
female under 18 |
|
Mean |
4.7277 |
.13357 |
||
|
95% Confidence Interval for Mean |
Lower Bound |
4.4652 |
|
|||
|
Upper Bound |
4.9903 |
|
||||
|
|
5% Trimmed Mean |
4.6675 |
|
|||
|
Median |
4.7500 |
|
||||
|
Variance |
7.815 |
|
||||
|
Std. Deviation |
2.79546 |
|
||||
|
Minimum |
.02 |
|
||||
|
Maximum |
12.08 |
|
||||
|
Range |
12.07 |
|
||||
|
Interquartile Range |
4.23 |
|
||||
|
Skewness |
.180 |
.117 |
||||
|
Kurtosis |
-.692 |
.233 |
||||
|
male under 18 |
|
Mean |
4.8044 |
.15035 |
||
|
95% Confidence Interval for Mean |
Lower Bound |
4.5089 |
|
|||
|
Upper Bound |
5.0998 |
|
||||
|
|
5% Trimmed Mean |
4.6625 |
|
|||
|
Median |
4.5000 |
|
||||
|
Variance |
10.670 |
|
||||
|
Std. Deviation |
3.26655 |
|
||||
|
Minimum |
.02 |
|
||||
|
Maximum |
15.00 |
|
||||
|
Range |
14.98 |
|
||||
|
Interquartile Range |
5.33 |
|
||||
|
Skewness |
.446 |
.112 |
||||
|
Kurtosis |
-.479 |
.224 |
||||
|
time sleeping |
female 18-35 |
|
Mean |
8.1277 |
.03255 |
|
|
95% Confidence Interval for Mean |
Lower Bound |
8.0639 |
|
|||
|
Upper Bound |
8.1915 |
|
||||
|
|
5% Trimmed Mean |
8.1206 |
|
|||
|
Median |
8.0000 |
|
||||
|
Variance |
3.556 |
|
||||
|
Std. Deviation |
1.88580 |
|
||||
|
Minimum |
.00 |
|
||||
|
Maximum |
18.58 |
|
||||
|
Range |
18.58 |
|
||||
|
Interquartile Range |
2.17 |
|
||||
|
Skewness |
.151 |
.042 |
||||
|
Kurtosis |
2.034 |
.084 |
||||
|
female 35-55 |
|
Mean |
7.8093 |
.02221 |
||
|
95% Confidence Interval for Mean |
Lower Bound |
7.7658 |
|
|||
|
Upper Bound |
7.8529 |
|
||||
|
|
5% Trimmed Mean |
7.7973 |
|
|||
|
Median |
7.7500 |
|
||||
|
Variance |
2.894 |
|
||||
|
Std. Deviation |
1.70109 |
|
||||
|
Minimum |
.00 |
|
||||
|
Maximum |
18.00 |
|
||||
|
Range |
18.00 |
|
||||
|
Interquartile Range |
1.88 |
|
||||
|
Skewness |
.179 |
.032 |
||||
|
Kurtosis |
2.218 |
.064 |
||||
|
female over 55 |
|
Mean |
7.7143 |
.10263 |
||
|
95% Confidence Interval for Mean |
Lower Bound |
7.5125 |
|
|||
|
Upper Bound |
7.9162 |
|
||||
|
|
5% Trimmed Mean |
7.6488 |
|
|||
|
Median |
7.5000 |
|
||||
|
Variance |
3.592 |
|
||||
|
Std. Deviation |
1.89516 |
|
||||
|
Minimum |
.00 |
|
||||
|
Maximum |
17.82 |
|
||||
|
Range |
17.82 |
|
||||
|
Interquartile Range |
2.00 |
|
||||
|
Skewness |
.851 |
.132 |
||||
|
Kurtosis |
4.458 |
.263 |
||||
|
male 18-35 |
|
Mean |
7.9231 |
.03839 |
||
|
95% Confidence Interval for Mean |
Lower Bound |
7.8478 |
|
|||
|
Upper Bound |
7.9984 |
|
||||
|
|
5% Trimmed Mean |
7.9058 |
|
|||
|
Median |
8.0000 |
|
||||
|
Variance |
4.184 |
|
||||
|
Std. Deviation |
2.04549 |
|
||||
|
Minimum |
.00 |
|
||||
|
Maximum |
18.00 |
|
||||
|
Range |
18.00 |
|
||||
|
Interquartile Range |
2.25 |
|
||||
|
Skewness |
.210 |
.046 |
||||
|
Kurtosis |
1.685 |
.092 |
||||
|
male 35-55 |
|
Mean |
7.6707 |
.02164 |
||
|
95% Confidence Interval for Mean |
Lower Bound |
7.6283 |
|
|||
|
Upper Bound |
7.7131 |
|
||||
|
|
5% Trimmed Mean |
7.6622 |
|
|||
|
Median |
7.6417 |
|
||||
|
Variance |
3.051 |
|
||||
|
Std. Deviation |
1.74665 |
|
||||
|
Minimum |
.00 |
|
||||
|
Maximum |
21.78 |
|
||||
|
Range |
21.78 |
|
||||
|
Interquartile Range |
1.91 |
|
||||
|
Skewness |
.179 |
.030 |
||||
|
Kurtosis |
2.721 |
.061 |
||||
|
male over 55 |
|
Mean |
7.7477 |
.07720 |
||
|
95% Confidence Interval for Mean |
Lower Bound |
7.5960 |
|
|||
|
Upper Bound |
7.8994 |
|
||||
|
|
5% Trimmed Mean |
7.7214 |
|
|||
|
Median |
7.6667 |
|
||||
|
Variance |
2.986 |
|
||||
|
Std. Deviation |
1.72807 |
|
||||
|
Minimum |
.00 |
|
||||
|
Maximum |
16.00 |
|
||||
|
Range |
16.00 |
|
||||
|
Interquartile Range |
2.00 |
|
||||
|
Skewness |
.346 |
.109 |
||||
|
Kurtosis |
2.487 |
.218 |
||||
|
female under 18 |
|
Mean |
9.2269 |
.10938 |
||
|
95% Confidence Interval for Mean |
Lower Bound |
9.0119 |
|
|||
|
Upper Bound |
9.4419 |
|
||||
|
|
5% Trimmed Mean |
9.1807 |
|
|||
|
Median |
9.0000 |
|
||||
|
Variance |
5.240 |
|
||||
|
Std. Deviation |
2.28918 |
|
||||
|
Minimum |
1.92 |
|
||||
|
Maximum |
16.42 |
|
||||
|
Range |
14.50 |
|
||||
|
Interquartile Range |
3.10 |
|
||||
|
Skewness |
.285 |
.117 |
||||
|
Kurtosis |
.121 |
.233 |
||||
|
male under 18 |
|
Mean |
9.1307 |
.11334 |
||
|
95% Confidence Interval for Mean |
Lower Bound |
8.9080 |
|
|||
|
Upper Bound |
9.3534 |
|
||||
|
|
5% Trimmed Mean |
9.1349 |
|
|||
|
Median |
9.0000 |
|
||||
|
Variance |
6.063 |
|
||||
|
Std. Deviation |
2.46234 |
|
||||
|
Minimum |
1.00 |
|
||||
|
Maximum |
16.00 |
|
||||
|
Range |
15.00 |
|
||||
|
Interquartile Range |
3.13 |
|
||||
|
Skewness |
.027 |
.112 |
||||
|
Kurtosis |
.320 |
.224 |
||||
SUMMARIZE /TABLES=T_work t_sleep BY age_gendr_categories /FORMAT=NOLIST TOTAL /TITLE='Case Summaries' /MISSING=VARIABLE /CELLS=COUNT MEAN MEDIAN.
Summarize
|
Case Processing
Summary |
|||||||
|
has_kids |
Cases |
||||||
|
Included |
Excluded |
Total |
|||||
|
N |
Percent |
N |
Percent |
N |
Percent |
||
|
.00 |
T_work * gender and age categories |
18035 |
100.0% |
0 |
.0% |
18035 |
100.0% |
|
time sleeping * gender and age categories |
18035 |
100.0% |
0 |
.0% |
18035 |
100.0% |
|
|
1.00 |
T_work * gender and age categories |
20331 |
100.0% |
0 |
.0% |
20331 |
100.0% |
|
time sleeping * gender and age categories |
20331 |
100.0% |
0 |
.0% |
20331 |
100.0% |
|
|
Case Summaries |
||||
|
has_kids |
gender and age categories |
T_work |
time sleeping |
|
|
.00 |
female 18-35 |
N |
1832 |
1832 |
|
Mean |
7.3170 |
8.2993 |
||
|
Median |
8.0750 |
8.2500 |
||
|
female 35-55 |
N |
3734 |
3734 |
|
|
Mean |
7.6494 |
7.8518 |
||
|
Median |
8.3333 |
7.8250 |
||
|
female over 55 |
N |
3142 |
3142 |
|
|
Mean |
6.8725 |
7.8510 |
||
|
Median |
7.7500 |
7.8333 |
||
|
male 18-35 |
N |
2306 |
2306 |
|
|
Mean |
7.9581 |
8.0730 |
||
|
Median |
8.5000 |
8.0000 |
||
|
male 35-55 |
N |
4002 |
4002 |
|
|
Mean |
8.2095 |
7.7524 |
||
|
Median |
8.7500 |
7.6667 |
||
|
male over 55 |
N |
3019 |
3019 |
|
|
Mean |
7.4528 |
7.8410 |
||
|
Median |
8.1667 |
7.7833 |
||
|
Total |
N |
18035 |
18035 |
|
|
Mean |
7.6111 |
7.9015 |
||
|
Median |
8.3000 |
7.9167 |
||
|
1.00 |
female under 18 |
N |
438 |
438 |
|
Mean |
4.7277 |
9.2269 |
||
|
Median |
4.7500 |
9.0000 |
||
|
female 18-35 |
N |
3357 |
3357 |
|
|
Mean |
6.9901 |
8.1277 |
||
|
Median |
7.8000 |
8.0000 |
||
|
female 35-55 |
N |
5867 |
5867 |
|
|
Mean |
6.8106 |
7.8093 |
||
|
Median |
7.7833 |
7.7500 |
||
|
female over 55 |
N |
341 |
341 |
|
|
Mean |
7.1221 |
7.7143 |
||
|
Median |
7.9333 |
7.5000 |
||
|
male under 18 |
N |
472 |
472 |
|
|
Mean |
4.8044 |
9.1307 |
||
|
Median |
4.5000 |
9.0000 |
||
|
male 18-35 |
N |
2839 |
2839 |
|
|
Mean |
8.0832 |
7.9231 |
||
|
Median |
8.6667 |
8.0000 |
||
|
male 35-55 |
N |
6516 |
6516 |
|
|
Mean |
8.1066 |
7.6707 |
||
|
Median |
8.8833 |
7.6417 |
||
|
male over 55 |
N |
501 |
501 |
|
|
Mean |
7.7798 |
7.7477 |
||
|
Median |
8.5000 |
7.6667 |
||
|
Total |
N |
20331 |
20331 |
|
|
Mean |
7.3710 |
7.8915 |
||
|
Median |
8.1667 |
7.8333 |
||