|
Lecture Notes 9 Econ 20150, Principles of Statistics Kevin R Foster, CCNY Spring 2012 |
|
|
A friend sent this,
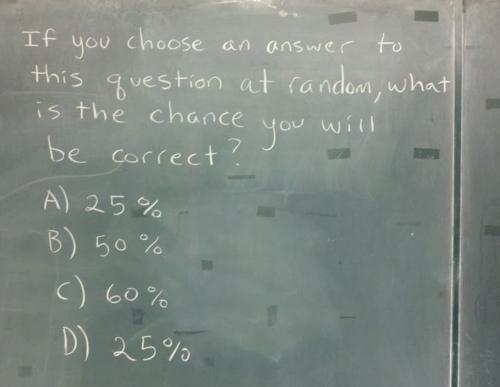
with note that it's not quite as easy as it looks at first...
More Examples of Hypothesis Tests:
1. In a medical study (reference below), people were randomly assigned to use either antibacterial products or regular soap. In total 592 people used antibacterial soap; 586 used regular soap. It was found that 33.1% of people using antibacterial products got a cold; 32.3% of people using regular soap got colds. Remember this formula for the standard error of the difference, it is
E.L.Larson, S.X. Lin, C. Gomez-Pichardo, P. Della-Latta, (2004). "Effect of Antibacterial Home Cleaning and Handwashing Products on Infectious Disease Symptoms: A Randomized Double-Blind Trial," Ann Intern Med, 140(5), 321-329.
2. A study of workers and managers asked both how much management listened to workers' suggestions (on a scale of 1-7 where "1" indicates that they paid great attention). Managers averaged a 2.50 (standard deviation of 0.55); workers answered an average 2.08 (standard deviation of 0.76) – managers ignore their workers even more often than the employees realize. There were 137 workers and 14 managers answering.
3. A survey by Intel showed that 53% of parents (561 were surveyed) were uncomfortable talking with their children about math & science. Previous surveys found that 57% of parents talked with their kids about sex & drugs.
4. The New York Times reported on educational companies that over-sell their products and gave the example of "Cognitive Tutor" (CT) that helps math students. The CT students improved by 17.41 (standard error of 5.82); the regular students improved by 15.28 (standard error of 5.33). There were 153 students in the new program and 102 regular students.
5. Bloomberg News reported on a US audit of mortgages, showing that the average number of "seriously delinquent" loans originated by Countrywide (now owned by Bank of America) was 6.76%, versus a general average of 3.59% made by all other originators. There were 4050 loans made by Countrywide. (H. Son, D. Kopecki, D. Griffin, Oct. 5, 2011, "BofA May Face Fraud Claims for Soured Loans," Bloomberg News.)
Examples of hypothesis testing with t-distributions
1. For a t Distribution with sample average of 1.98, standard deviation of 1.37, and 8 observations, what is the area in both tails, for a null hypothesis of zero mean?
Answer: The standard error of the average is 1.37/sqrt(8) = 0.484. The test statistic against the null hypothesis of zero mean divides the average by its standard error, so 1.98/0.484 = 4.09. Then use Excel (or other program or look up in a table) to find that TDIST(4.09, 7, 2) [a t-distribution with 7 degrees of freedom {=8 – 1} and 2 tails] = 0.0046.
2. For a t Distribution with sample average of 2.76, standard deviation of 1.16, and 28 observations, what is the area in both tails, for a null hypothesis of zero mean ?
3. For a t Distribution with sample average of 0.85, standard deviation of 0.37, and 5 observations, what is the area in both tails, for a null hypothesis of zero mean ?
4. For a t Distribution with 22 observations and standard deviation of 2.12, what sample mean leaves 0.10 in the two tails?
5. For a t Distribution with 9 observations and standard deviation of 1.19, what sample mean leaves 0.05 in the two tails?
6. For a t Distribution with 30 observations and standard deviation of 2.95, what sample mean leaves 0.01 in the two tails?
7. Sample A has mean 1.92, standard deviation of 2.24, and 26 observations. Sample B has mean 3.57, standard deviation of 1, and 29 observations. Test the null hypothesis of no difference.
8. Sample A has mean 2.16, standard deviation of 1.06, and 17 observations. Sample B has mean 2.69, standard deviation of 0.02, and 16 observations. Test the null hypothesis of no difference.
9. Sample A has mean 2.96, standard deviation of 0.89, and 18 observations. Sample B has mean 0.11, standard deviation of 2.89, and 12 observations. Test the null hypothesis of no difference.
Extra to work on:
10. For a t Distribution with sample average of 4.41, standard deviation of 0.35, and 7 observations, what is the area in both tails, for a null hypothesis of zero mean ?
11. For a t Distribution with sample average of 1.16, standard deviation of 2.7, and 7 observations, what is the area in both tails, for a null hypothesis of zero mean ?
12. For a t Distribution with sample average of 0.03, standard deviation of 2.35, and 5 observations, what is the area in both tails, for a null hypothesis of zero mean ?
13. For a t Distribution with 24 observations and standard deviation of 1.25, what sample mean leaves 0.56 in the two tails?
14. For a t Distribution with 11 observations and standard deviation of 0.05, what sample mean leaves 0.48 in the two tails?
15. For a t Distribution with 4 observations and standard deviation of 0.48, what sample mean leaves 0.92 in the two tails?
16. For a t Distribution with 8 observations and standard deviation of 1.05, what sample mean leaves 0.69 in the two tails?
17. Sample A has mean 4.9, standard deviation of 2.19, and 27 observations. Sample B has mean 4.48, standard deviation of 0.84, and 5 observations. Test the null hypothesis of no difference.
18. Sample A has mean 3.24, standard deviation of 0.2, and 9 observations. Sample B has mean 0.49, standard deviation of 1.96, and 22 observations. Test the null hypothesis of no difference.
19. Sample A has mean 0.01, standard deviation of 0.01, and 15 observations. Sample B has mean 4.04, standard deviation of 2.6, and 2 observations. Test the null hypothesis of no difference.
20. Sample A has mean 0.34, standard deviation of 2.14, and 27 observations. Sample B has mean 4.94, standard deviation of 1.1, and 18 observations. Test the null hypothesis of no difference.
21. Sample A has mean 0.54, standard deviation of 0.71, and 20 observations. Sample B has mean 3.09, standard deviation of 0.14, and 27 observations. Test the null hypothesis of no difference.
22. Sample A has mean 2.31, standard deviation of 2.98, and 23 observations. Sample B has mean 0.85, standard deviation of 2.65, and 12 observations. Test the null hypothesis of no difference.
23. Sample A has mean 3.95, standard deviation of 2.33, and 30 observations. Sample B has mean 4.59, standard deviation of 0.14, and 2 observations. Test the null hypothesis of no difference.
24. Sample A has mean 3.99, standard deviation of 1.59, and 26 observations. Sample B has mean 0.1, standard deviation of 1.93, and 4 observations. Test the null hypothesis of no difference.
25. Sample A has mean 3.95, standard deviation of 2.56, and 22 observations. Sample B has mean 2.23, standard deviation of 0.82, and 18 observations. Test the null hypothesis of no difference.