|
Basic Background Knowledge: Review of Economics especially for SUS students 1. Consumers Economics of the Environment and Natural Resources/ Economics of Sustainability K Foster, CCNY, Spring 2012 |
|
|
Although there are hard-core environmentalists who dispute it, as economists we must keep in mind that, to efficiently allocate scarce resources and to ensure that resources are most effectively used, markets are the best way that human ingenuity has been able to discover. This is true for most resources.
It is not true for all resources; this does not mean that no government intervention is ever justified. One of the objectives of this course is to figure out what institutional arrangements and structures allow markets to work, and which ones need to be improved. Where should government policy step in?
But a typical firm is run by managers who have a sharp incentive to cut costs: to limit the use of expensive inputs and to cut expenditures which do not directly impact customer satisfaction. Most consumers are looking for ways to cut their expenditures on items that do not bring adequate satisfaction.
So to begin, we will review basic economic theory about the allocation of scarce resources. Keep in mind that generally scarcity leads to a high price. An item with a high price will have lower demand from consumers. Items with high prices will not be used as intensively by producers. Both consumers and producers will cut back usage of the expensive resource in favor of cheaper resources.
|
1. Economics is the study of choice in a world of scarcity (from intro text by Frank
& Bernanke |
|
|
a. Some resources, which were once thought to be inexhaustible, are now known to be scarce; e.g. atmosphere (CO2 levels), clean air, fish in the sea
b.
Scarcity: No Free Lunch (TANSTAAFL) more of one thing means less of something
else. This applies to buying groceries
(more apples & fewer bananas) or choosing between car emissions &
safety (lighter cars mean better MPG & less emissions but also less safe in
accident).
c.
Choice: people are free agents who take
actions based on their own information and desires which do not necessarily match those of
policymakers. Usually assume people are
rational.
d. Rational people think on the margins (Mankiw's intro text)
e. Cost-Benefit Principle: it is rational to take action if and only if the extra benefits are as big as, or bigger than, the extra costs
i.
Economic Surplus = Extra Benefit Extra Cost.
So Cost-Benefit Principle can be restated as "Do actions with
nonnegative Economic Surplus".
ii. Opportunity Cost: The Extra Cost is the value of next-best alternative that must be given up to do something so Cost-Benefit means take an action only if it has nonnegative Economic Surplus; only if the extra Benefit exceeds the Opportunity Cost
f. If prices reflect true scarcity of all goods then people take proper account, not because of any moral feeling but to maximize profit. This goes back to Adam Smith's propositions and observations.
g. Environmental Economics is generally concerned with choices where the benefits and costs are shared even though the decision-making isn't necessarily
|
2. Basics of Supply and Demand Curves |
|
|
a. Demand Curve:
i. For each person: shows the extra benefit gained from consuming one more unit
ii. by Cost-Benefit Principle, if the extra benefit from consuming one more unit is greater than the price, then consume; if not then don't
iii. so Individual Demand Curve shows how many are purchased at any given price
iv. Individual Demand Curves are combined to get a market demand curve of how many would be purchased by all the people in the market at a given price (horizontal sum)
v. Depend on other factors than price (which shift the demand curve).
b. Supply Curve: opportunity cost of producing certain quantity of output.
i. If no fixed costs and no barriers to entry then firms produce at marginal cost
ii. Depend on other factors than price (which shift the supply curve).
c. Behavior of Markets: markets are a wonderful institution; we analyze with some assumptions
i. Depend on composition of good
ii. Depend on supply characteristics (how many firms, if there are fixed costs or other barriers to entry, rules & regulations and social norms
iii. property rights are completely known, specified & enforceable
iv. all property rights are exclusive (no externalities)
v. property rights are transferable
vi. items for sale have substitutes
vii. Commodities closely approximate these assumptions; other markets might be very far off (e.g. labor)
viii. What happens if demand is greater than supply? Vice versa?
d. Equilibrium: price and quantity that have no tendency for change
e. Some Common Mistakes
i. Ignore Opportunity Costs
ii. Fail to Ignore Sunk Costs (since they're no longer on the margin)
iii. Fail to understand Average/Marginal Distinction
|
3. Analyzing Supply and Demand Curves |
|
|
a. Consumer Surplus (CS)
i. You've surely had the experience: you go to a store to buy a particular item, ready to spend a certain amount of money. But surprise! You find it's on sale and you pay less than you expected. You've gotten Consumer Surplus. This did not come from the benevolence of the retailer (although they might try to convince you otherwise). This actually was a mistake by the retailer: they were targeting people whose choice could be influenced by the price reduction but accidentally got you too. You got a benefit from the fact that other people shop smart, with a keen eye on prices charged. You would have been willing to pay more, but because there's a market you paid less.
ii. Take all of the people who would have been willing to pay more than the actual market price and add up how much they each benefited. This total amount is CS: the area under the demand curve and above the market price. Consumers were willing to pay more than the market price; their marginal benefit from consuming those goods was above the price they paid, so they gained from this market.
iii. Examples: online websites, from eBay
to used cars, allow people to see the prices paid for other similar
products. Compare with buying a used car
without internet research must go to each dealer and haggle; don't know
if price is good or bad without substantial experience.
iv. This could sound like an abstract
concept, but ordinary people have an intuition of it. For example, people regularly
pay a flat fee to join a "warehouse club" like Costco. They benefit from shopping at lower prices
(i.e. they get consumer surplus) and are willing to pay for that benefit as long as their payments are less than the
benefits, of course.
b. Producer Surplus (PS)
i.
Producers
also gain from a market. You are a
producer and seller of your own labor.
If you applied for a job and would have accepted a pretty low wage but you were surprised and the company offered
you a better wage than you would have accepted
then you got Producer Surplus. You benefit from the fact that there is a
market with competitors trying to buy the product.
ii. Find the difference between the lowest price that the producer would have accepted (supply curve) and the actual price received. Add these all up for PS: the area above the supply curve and below the price is Producer Surplus. Producers were willing to accept less than the market price; their opportunity cost was lower than their revenue so they gained from the market.
iii. Examples: In a natural resource case, a dairy farmer might be willing to sell milk at even a very low price because the milk is tough to store and spoils quickly. But in a large market the milk can find a buyer at a decent price so the farmer gets PS. A mine where the ore is near the surface and easily accessible would sell the product even at a very low price. But the market offers a higher price because buyers compete for it, so the existence of the market provides a benefit to the producers.
c. Pareto Improving Trade: a trade that makes both sides better off. If markets allow all Pareto-Improving trades then the market maximizes Total Surplus (= sum of Consumer Surplus plus Producer Surplus)
i. Example from Economist, "Economics Focus: Worth a Hill of Soyabeans," Jan 9, 2010 (on Blackboard and InYourClass.com).
d. Deadweight Loss (DWL): a loss that is nobody's gain.
i. Example: Traffic to get over a bridge. Everybody pays a price of lost time and aggravation but this cost is nobody's gain. If everybody paid an equivalent price in money (as a toll) then this cost would be somebody's gain (the government, the public, and/or politicians' cronies).
ii. This is one of the less widely-understood concepts; for example take the voters' dislike to road pricing here in NYC
e.
Price
floor/ceiling effects examples where Total Surplus is smaller &
there is DWL; "Short side rules"
f. Effects of changes in demand or supply
g. Private equilibrium leaves no unexploited opportunities for individuals (no-cash-on-the-table); but might leave opportunities for social action. (See Yoram Bauman, the Stand-up Economist in AIR or on youtube here or here)
h.
Elasticity
allows easy characterization of how changes in demand or supply affect market; is
i. Elasticity works in both directions:
i. if amount supplied were to fall by 10%, what would happen to price?
ii. if price rose by 5%, what would happen to the amount demanded?
iii. Example
of recent analysis by Jim Hamilton (EconBrowser Jan 15, 2012): what would be
the effect of an embargo on Iranian oil shipments? If Iran is about 5% of global market and
elasticity is something like to 1/6 or even 1/10, then this means a 5% drop
of supply would produce a 20-30%or even (worst case) 50% increase in crude oil prices.
j. Cross-Price Effects
i.
Finally
check the effects of a change in the price of one good on the consumption of
the other good, so .
If this cross-price effect is positive then the goods are substitutes:
an increase in the price of one leads consumers to buy more of the other
instead (chicken vs beef). If the
cross-price effect is negative then the goods are complements: an increase in
the price of one leads consumers to cut back purchases of several items
(hamburgers and rolls).
k. Elasticity: when a price rises from p to p', so demand changes from x to x'
i. linear
Linear elasticity is or
.
ii. point
As
p' and p get closer and closer together (so that x' and x get closer as well),
then the term,  so that the elasticity formula can be written
as
so that the elasticity formula can be written
as (and recall that x is a function of p). For a linear demand curve, note that elasticity
is not constant. The slope of a line is
constant, then
is constant but elasticity is this constant
times
, which is the slope of a ray from
the origin to the point under consideration.
|
4. Individual Demand to Market Demand |
|
|
a. horizontal sum
At a quoted price, each person chooses to demand a certain quantity of the good (which might be zero). So if there are 3 people, A, B, and C,
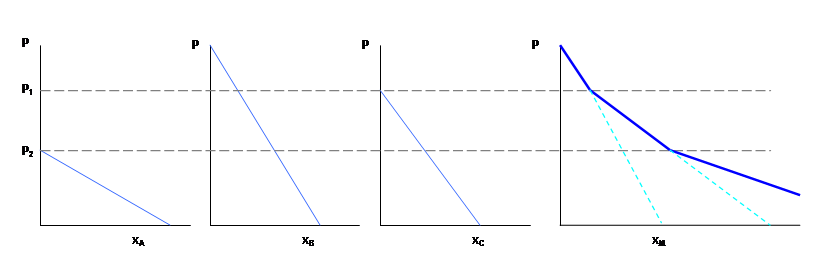
At a price above P1, only person B is in the market, so the market demand is just her demand. At a price lower than P1 but above P2, a reduction in price will prompt both B and C to demand the good. At a price lower than P2, all three people A, B, and C, are in the market. So a reduction in price induces all three to demand more. The market demand curve becomes more elastic since now a fall in price means ΔxA + ΔxB + ΔxC. The market elasticity arises both from intensive changes (each person's demand changes) and extensive changes (people enter or leave the market in response to price changes).
|
|
|
On using these Lecture Notes:
We sometimes don't realize the real reason why our good habits work. In the case of taking notes during lecture, this is probably the case. You're not taking notes in order to have some information later. If you took your day's notes, ripped them into shreds, and threw them away, you would still learn the material much better than if you hadn't taken notes.
The process of listening, asking "what are the important things said?," answering this, then writing out the answer in your own words that's what's important!
So even though I give out lecture notes, don't stop taking notes during class. Take notes on podcasts and video lectures, too. Notes are not just a way to capture the fleeting sounds of the knowledge that the instructor said, before the information vanishes. Instead they are a way for your brain to process the information in a more thorough and more profound way. So keep on taking notes, even if it seems ridiculous. The reason for note-taking is to take in the material, put it into your own words, and output it. That's learning. |
|
|
|
5. Production Possibility Frontier (PPF) |
|
|
In analyzing choices we distinguish between what is possible and what is desirable; an optimal choice balances these two considerations. To analyze what is feasible or possible we sketch a Production Possibility Frontier.
The Production Possibility Frontier (PPF) represents the combinations of two goods which can possibly be attained. (The PPF shows the maximum; certainly less of both is possible!)
For example, politicians debate the tradeoff between cheap oil/gas (Drill Baby Drill!) and a clean environment. We can represent this tradeoff as
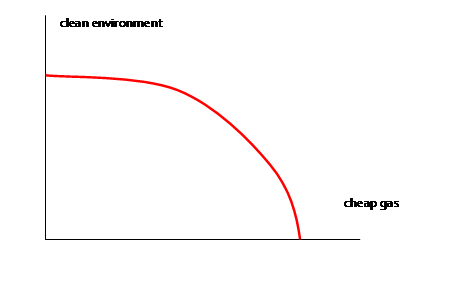
This shows that a society could have a completely clean pristine environment with zero cheap gas (where the PPF intersects the vertical axis). Or an utterly dirty environment and ultra-cheap gas (where the PPF intersects the horizontal axis). We would never want to be interior to the PPF, since this would mean that society could have more of both without any sacrifice. It is a frontier because anything beyond it is infeasible; anything within it is inefficient. Changing technology would allow the PPF to move outward so that society could have more of both.
The
opportunity cost is proportional to the slope of the PPF. The slope changes depending on how much
drilling or environment we already have.
If we already have a very clean environment with a low level of cheap
gas (at a point near the upper left of the PPF), then getting even cleaner
(moving up and left) requires a huge reduction in cheap gas to get only a small
improvement in clean environment the opportunity cost of the last bits of
environment is huge. Oppositely, if we
have a lot of cheap gas but little clean environment (we're on the lower
right), then cleaning up some means a small sacrifice of cheap gas (a low
opportunity cost). People can have
different preferences about what sacrifice is reasonable and so where on the
PPF the society ought to be.
From the PPF we can immediately define the opportunity cost: how much does a completely unspoiled landscape "cost"? The value of the gas which must be foregone. How much does gas "cost"? The value of the habitat spoiled. If choices must be made between the two priorities then every step toward one priority means some diminution of progress to the other priority.
Many examples: a lake can be used for recreation or reservoir of water supply; rainforest can be used for biodiversity or crops; land can be mined or left open; coast used for wind farm or beautiful scenery; etc. Application to Global Climate Change.
|
6. Indifference Curves |
|
|
We analyze the choice of an individual balancing two desired outcomes. There are some cases where both outcomes are easily achieved; here economics has little to add. There are other cases where there is a trade-off, where progress toward one goal must mean that the other goal becomes farther off. These cases are more difficult.
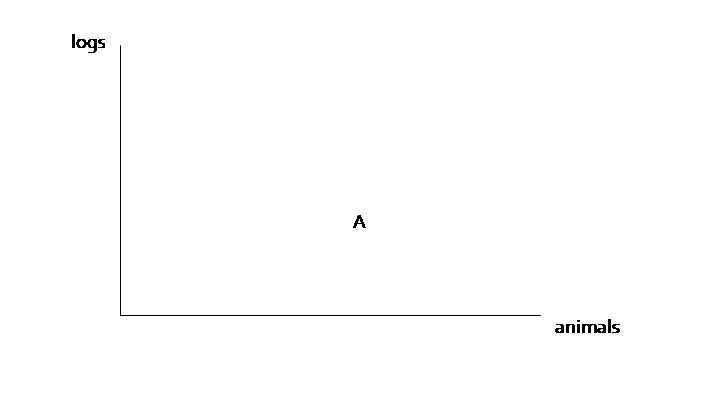
Consider the choices of people who like forests for recreational use (including habitat preservation) as well as for a source of logs (supporting the local economy). We will shorten these two outcomes as "animals" and "logs".
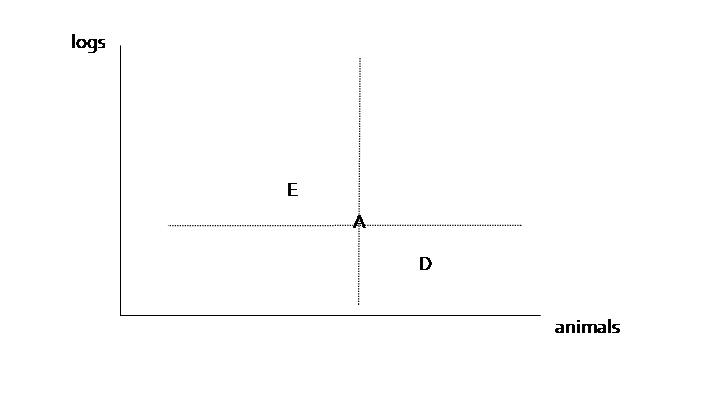
Start from a particular point, where there is some amount of both logging and preservation, so point A:
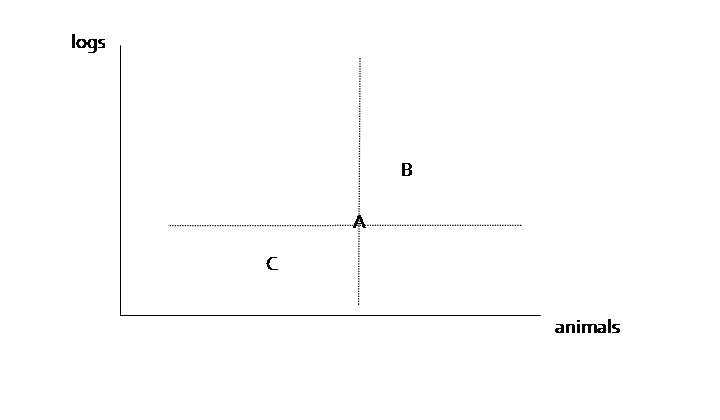
Assuming the person likes both logging and preservation of habitat, any combination (such as B) that gave more of both would be preferred; any combination (such as C) that gave less of both would be less preferred (the dotted vertical and horizontal lines through A mark the current amounts of logs and animals).
Preferences get complicated when we ask how a person would trade off one good for another. What increment more wildlife habitat (more animals) would balance slightly less logging? Call this point D. What increment more logging would balance slightly less habitat? Call this point E.
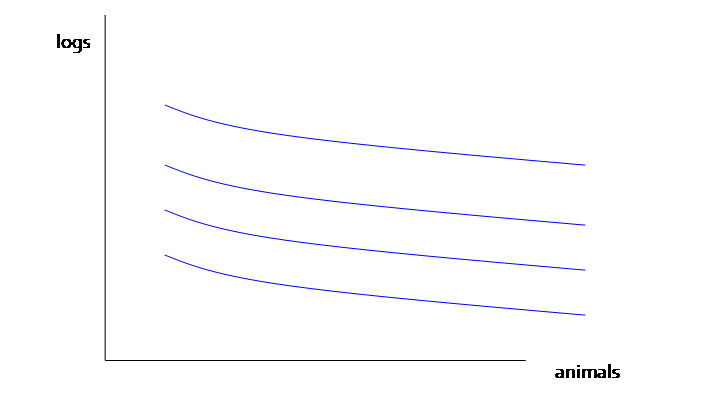
Connect together these points into a smooth curve, which we call an "indifference curve" because the person is indifferent between the various options.
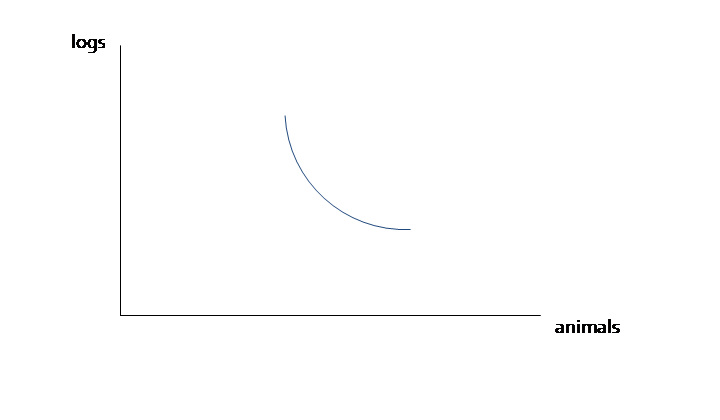
One person's preferences might look like this:
which implies that this person likes both logs and animals. Indifference curves above are preferred; indifference curves below are less preferred.
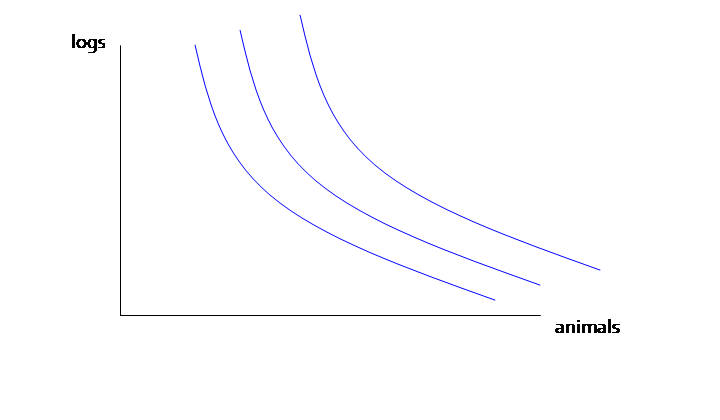
Different people might have different preferences. This person likes animals and cares very little about logs:
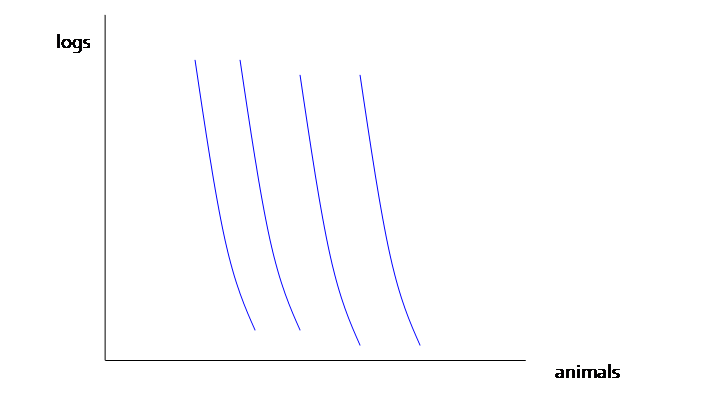
While this person cares about logging jobs and not much at all for animals or habitat:
Horizontal or vertical curves would represent complete lack of caring for a particular outcome. This might accurately represent the views of some people on the extremes.
Why do we usually sketch the indifference curves as bowed? This is again an assumption about behavior on the margin. Return to an individual with preferences that are not too extreme,
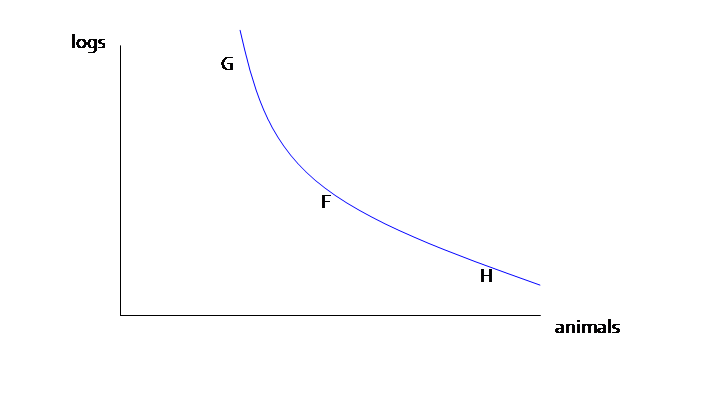
From a point
in the middle, such as point F, the person might make an almost equal tradeoff
– a 1%diminution of habitat for a 1% increase in logging (for
instance). However as the person moved
upwards and leftwards (toward G), they might want a greater compensation of
logging increase for equal diminutions of animal habitat. If there is a giant park then people might be
willing to allow logging in a few areas but as the size of the wilderness
shrinks, they become less willing to give up the remaining bits. Oppositely as the choices move from F toward
H: more and more habitat is protected and so becomes less valued. This is the principle of diminishing marginal
utility. (Diminishing marginal utility
is the idea that, when I'm thirsty, that beer tastes great; when I've already
had a few, I don't get quite as much enjoyment from one more beer.)
Note on Aggregating Preferences: although we derived a market demand curve from individual demand curves above, aggregating indifference curves is not so easy (in fact it's generally impossible!). Aggregating PPFs is simple, though.
|
7. Optimal Choice |
|
|
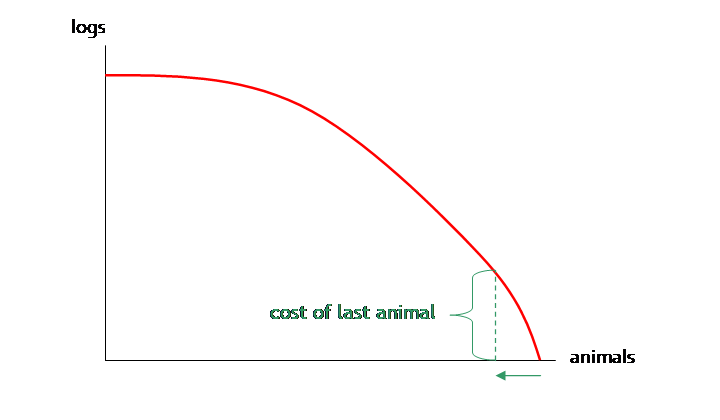
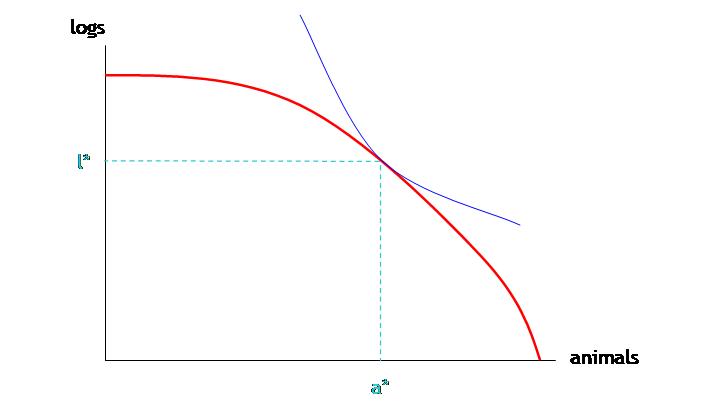
Make the (not entirely serious) assumption that we have some units to measure "animals" and "logs". Starting from a value of zero logs and all animals, suppose we reduced the number of animal units by one? How many more logs could we get? This gives the opportunity cost of the last unit of animals.
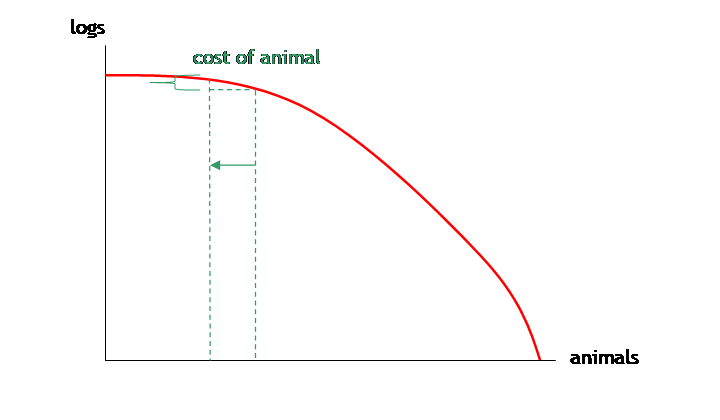
But compare this high cost with the cost (in log units) of reducing the amount of animal, if the amount of animal is already small:
Somehow the society must figure a way to bring these two considerations of production possibilities and choice into equilibrium, to find the tangent of PPF and indifference curve:
A rational maximizing individual who does all of the production by him or herself, and knows his or her own indifference curves, would make this choice. In a world where production and consumption are separated, each side sees only the price,
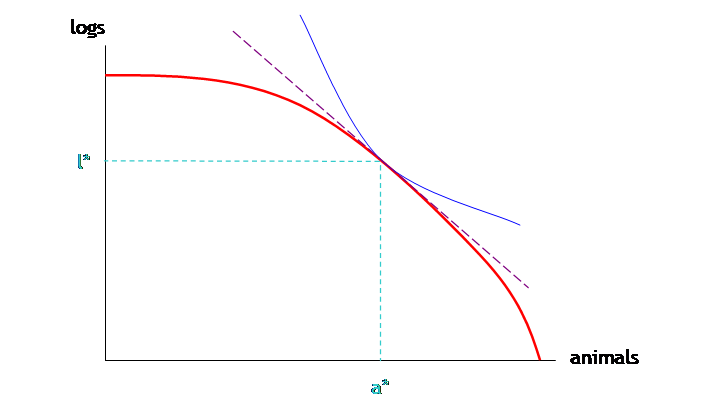
So producers see only the relative price of a to l but choose optimally; consumers see the relative price and also consume optimally.