|
Homework 1 Possible Solutions Economics of the Environment and Natural Resources/Economics of Sustainability K Foster, CCNY, Spring 2012 |
|
|
- Consider a
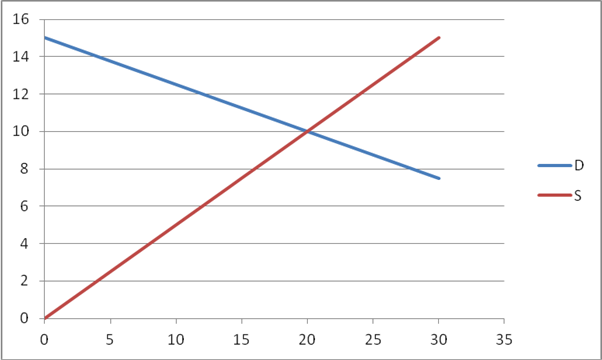
market that can be represented by a linear demand curve, QD = 60
4PD, (where QD is the quantity demanded and PD is the price that demanders pay) and a linear supply curve that QS = 2PS (where QS is the quantity supplied and PS is the price that suppliers get).
- Graph the two functions with P on the vertical axis.

At
P=14, Qd = 60 4(14) = 4 but Qs = 2(14) = 28 so there is a
vast over-supply. Only 4 are actually
bought and sold; the remaining 24 units are not sold. Consumer surplus is the blue triangle shown
below, with height 1 and base of 4 so area is 2. Producer surplus is the pink trapezoid below
with area of 52.

![]()
- At a price of 8, how many units are demanded and supplied? What would be Consumer and Producer Surplus if this price prevailed?
At
P=8, Qd = 60 4(8) = 28 but Qs = 2(8) = 16, so demand is
greater than supply. The quantity bought
and sold is 16 and the rest of the orders are unfulfilled. So Producer Surplus is the area of the pink
triangle below, .5*8*16 = 64. Consumer
Surplus is the blue trapezoid with area 3*16 + .5*4*16 = 80.


- Set PD=PS and QD=QS and solve the system of equations to find the equilibrium (find the intersection of the lines). Show on the graph.
The lines intersect where 60-4P=2P, so P=10 and Q=20.
- What are CS & PS now? Show on the graph. Compare Total Surplus for the 3 cases.
Now CS is the triangle of height 5 and width 20 so area is 50; PS is height 10 and base 20 so area is 100. Total Surplus at the high price was 54; at the low price was 144; at the equilibrium price was 150, which is the maximum.
- Suppose the government sets a tax of $3 per unit. This means that PD = PS + 3. What is now the quantity demanded & supplied? What are CS & PS now? What is government revenue (which adds to total surplus)? What is DWL (deadweight loss)?
Note
that and
. Put these into the equation about tax, so
,
![]()
Qt
= 16, where Ps = 8 and Pd = 11. Now PS =
64 (from part c); CS is .5*4*16 = 32.
Government revenue is 16*3 = 48. Total
surplus is 144 and DWL is 6 the area of the triangle with height 3 and
base (20-16)=4.
- Suppose that production of this good has an external cost of $3.50 per item. What is the DWL of the free market equilibrium? What is the DWL of the tax case?
Now the free market case has DWL since too much is produced: to cost to society is the 0.5Q paid by firms plus 3.5. The social optimum would be the quantity where .5Q+3.5 = 15-.25Q, so Q** = 15.33 and P**=11.167. The free-market DWL is the grey triangle below with area of .5*3.5*(20-15.33) = 8.167.
![]()

![]()
![]()


However with the tax, the quantity produced and consumed has fallen to 16 so the DWL is much smaller since there are only .67 too many units of output so the damage is also smaller. The DWL in this case is just .5*(11.167-11)*(16-15.33) = 0.056, shown as the smaller light-grey triangle.
- A small country
can use its coast for tourism (people are attracted to pristine coastline)
or business/industry (which destroys the tourist appeal). It wants to choose what percent of coast
should be preserved for tourism and how much should be kept for industry. Assume that the two industries can be
modeled as follows. The coast (C)
can be used for tourism, T, or business, B, where each is a percentage so . The jobs from businesses (in hundreds) can be modeled asand, symmetrically, the number of tourists (in thousands) is. From combining the first two equations we can write; from the third equation we can write.
- If 100% of the coast is used for tourism, what is the maximum number of tourists? If 100% were used for business, what is the maximum number of jobs?
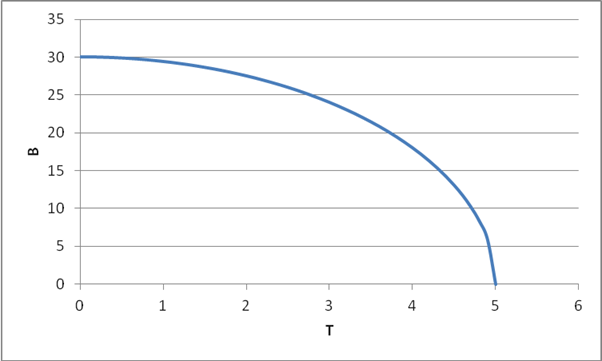
If the coast is 100 tourism then T=.5*sqrt(100)=5. If the coast is 100 business then B=3*sqrt(100) = 30.
- Write the equation giving B as a function of T. Graph it. (You can use Excel to plot points if it's easier.)
From and
,
write
.
- What is the opportunity cost, of business given up, if the island moves from zero to one tourist unit? (You can use calculus or find the change between values.)
At T=0, B=30; at T=1, B=29.4 so the cost of the first thousand T is 0.6 of B (60 jobs).
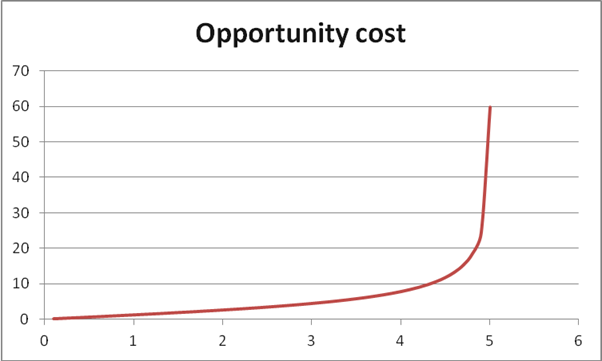
- What is the opportunity cost, of business jobs given up, for each unit of tourism, if the island moves to 100% tourism? Plot the opportunity cost.
From T=4 to T=5, B falls from 18 to zero so the cost of the last thousand tourists is 18 (so 1800 jobs).
- Do the same exercise (find opportunity cost and plot), but find opportunity cost in terms of tourists, for integer units of business jobs.
This is in the spreadsheet (for each tenth of a T); graph is below.
- What is the best combination? What additional information is needed?
There
is no unambiguous choice of "best" it depends on other information such as the
non-pecuniary benefits of the unspoiled coastline, the relative valuation of
tourists vs jobs, the sustainability of each choice and the future prospects.
- Please complete the "Problems for Review" in the textbook: Chapter 2, Questions 3 and 4.
Question 2.3 asks about general shapes of PPFs for things like cattle vs lumber; it seems reasonable to expect that the shape will be similar to the graphs we've shown so that, from a situation of 100% cattle and no lumber, the first extractions of lumber would barely interfere with the cattle, but more lumber would mean fewer cattle.
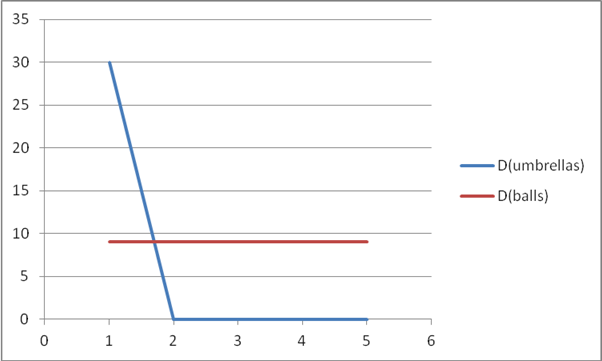
Question 2.4 asks for demand curves of Ally, who would pay $30 for one umbrella but zero additional for more umbrellas, versus soccer balls that are $9 no matter how many she already has. These would look like: